One Number Turned a Forgotten Stock Into a $2.4 Billion Giant. A Smaller Company Just Posted a Bigger One. A tiny company just claimed America's largest antimony resource, and the last byEquediaJuly 15, 2026
The Hole That Refused to Quit 250 metres underground — past where these gold systems are supposed to die — a byEquediaJune 23, 2026
A Trillion-Dollar Trade Hiding in Plain Sight While the basic investors argue about chatbots, chips, and trillion-dollar byEquediaJune 7, 2026
By the Time You Read This, They’ve Already Bought More The most powerful institutions are buying it at a pace we haven't seen in over byEquediaApril 27, 2026
Commodities and Resource Gold Instructional Metals and Mining Stock Charts Technical AnalysisMarch 1, 2022 Positive Technical Signals for Gold: Chart Analysis Since gold has been on a wild ride lately, we're doing another gold chart
Gold Instructional Metals and Mining Stock Charts Technical AnalysisFebruary 25, 2022 Weekly Gold Chart Analysis: Testing Key Resistance Level With rising geopolitical tensions, gold is once again being accumulated -
Gold Instructional Metals and Mining Stock Charts Technical AnalysisFebruary 20, 2022 TSX Gold Index (Finally) Looking Much Better Gold stocks have been lagging gold - but is now finally their time to shine?
Instructional Stock Charts Technical AnalysisFebruary 18, 2022 Dow by Candlelight – At Key Support Level A look at the Dow weekly chart and what the recent drop means for technical
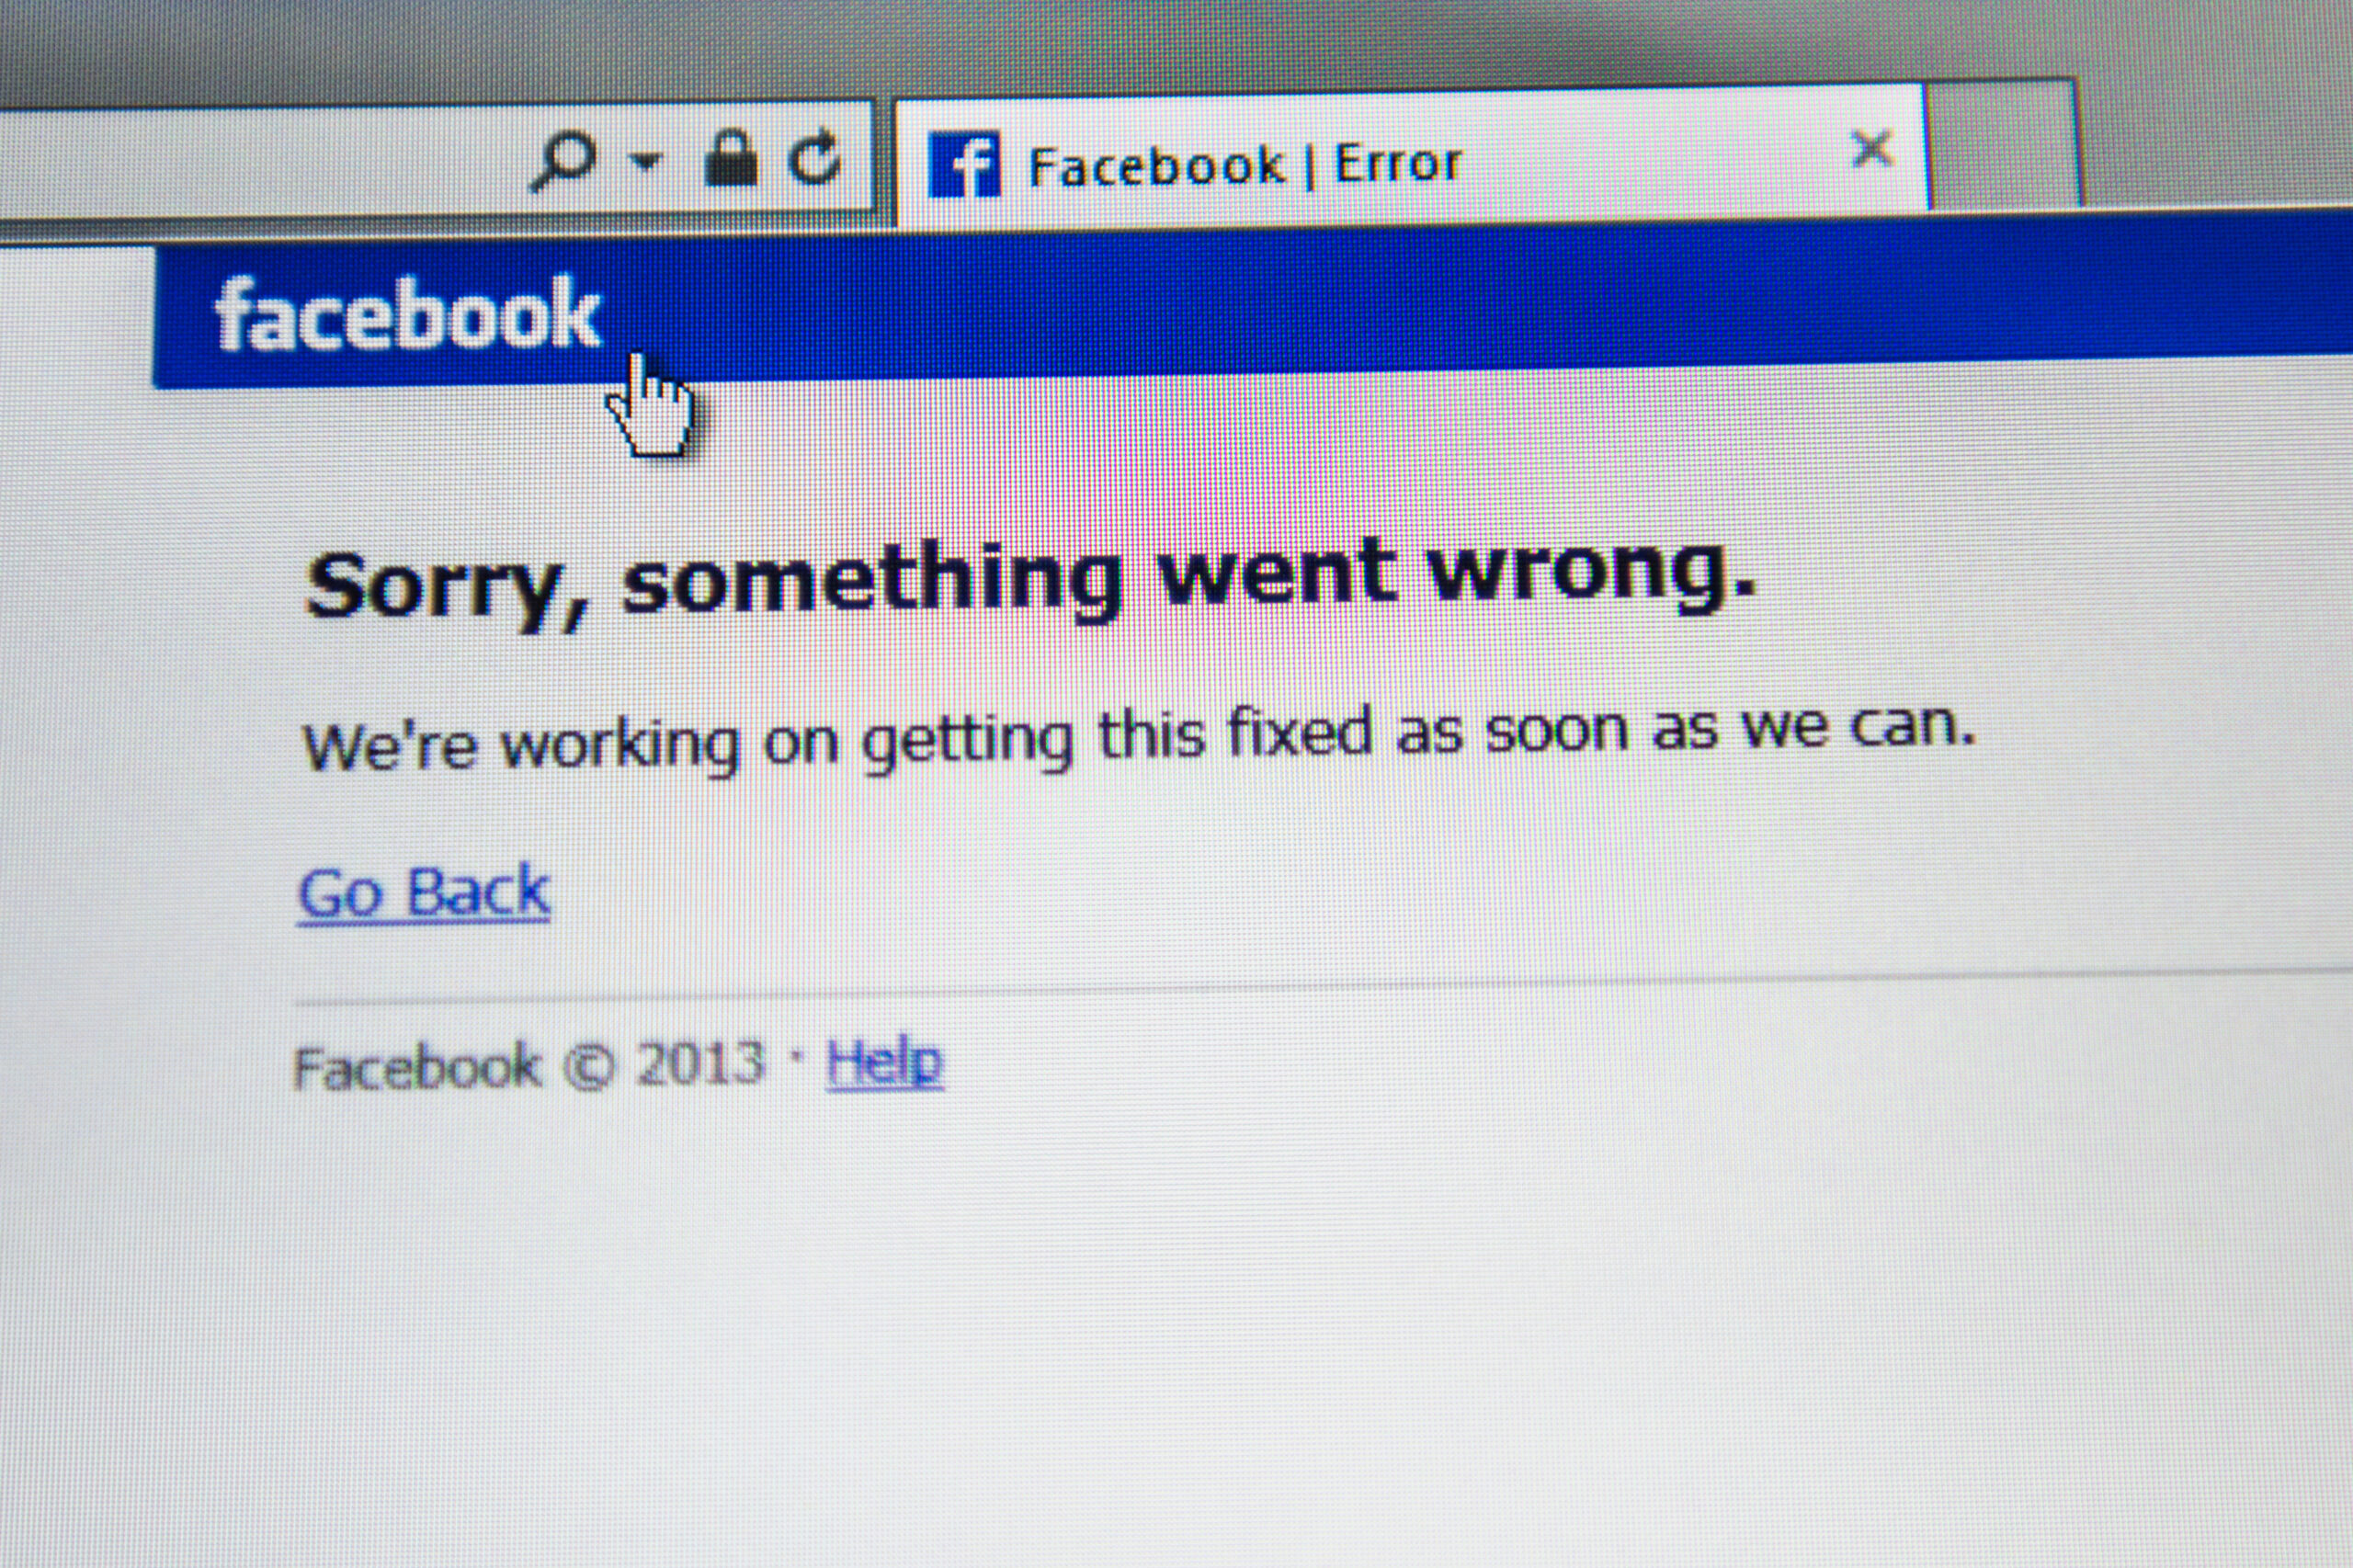
Instructional Internet Services Stock Charts Technical AnalysisFebruary 6, 2022 Fibonacci Knew Facebook Would Selloff Here's how the followers of the Fibonacci trading signal knew Meta
Gold Instructional Stock Charts Technical AnalysisJanuary 3, 2022 Is Gold Back to Its Old TRIX? TRIX is a technical oscillator for the monthly gold chart that may prove to be
Gold Instructional Metals and Mining Stock Charts Technical AnalysisDecember 31, 2021 US Dollar Chart Analysis December 2021 US Dollar chart analysis: A look at the US Dollar long-term chart to see where
Instructional Stock Charts Stock Exchanges Technical Analysis US Stock ExchangesDecember 18, 2021 Bull vs. Bears: Stalemate Despite the market dropping, there are still signs of positive momentum
Financial Stock Charts Technical Analysis US Stock ExchangesDecember 12, 2021 Dow Chart Analysis: December 12, 2021 Based on our DOW chart analysis last week, it seemed likely to dip below its
Instructional Stock Charts Technical Analysis US Stock ExchangesDecember 3, 2021 DOW Daily Chart Reveals Concentrated Selling: What’s Next? What the DOW chart is telling us including daily chart analysis, resistance and
Instructional Market Outlook Stock Charts Technical AnalysisNovember 29, 2021 Daily Chart Analysis for the DOW Dow Daily Chart Analysis: The Dow had one of the worst days of the decade - Here
Instructional Market Outlook Stock Charts Technical AnalysisNovember 5, 2021 Financial Titration: How Slow Will Interest Rates Rise? The FED has a plan to withdraw its stimulus program