
Daily Chart Analysis for the DOW: Gapping Lower Below a Key Level
“What a difference a day makes.”
Last Friday, the DOW daily chart gapped below its EMA (89) level. It has done this before, once at the start of COVID fears and again around the 2020 Presidential election.
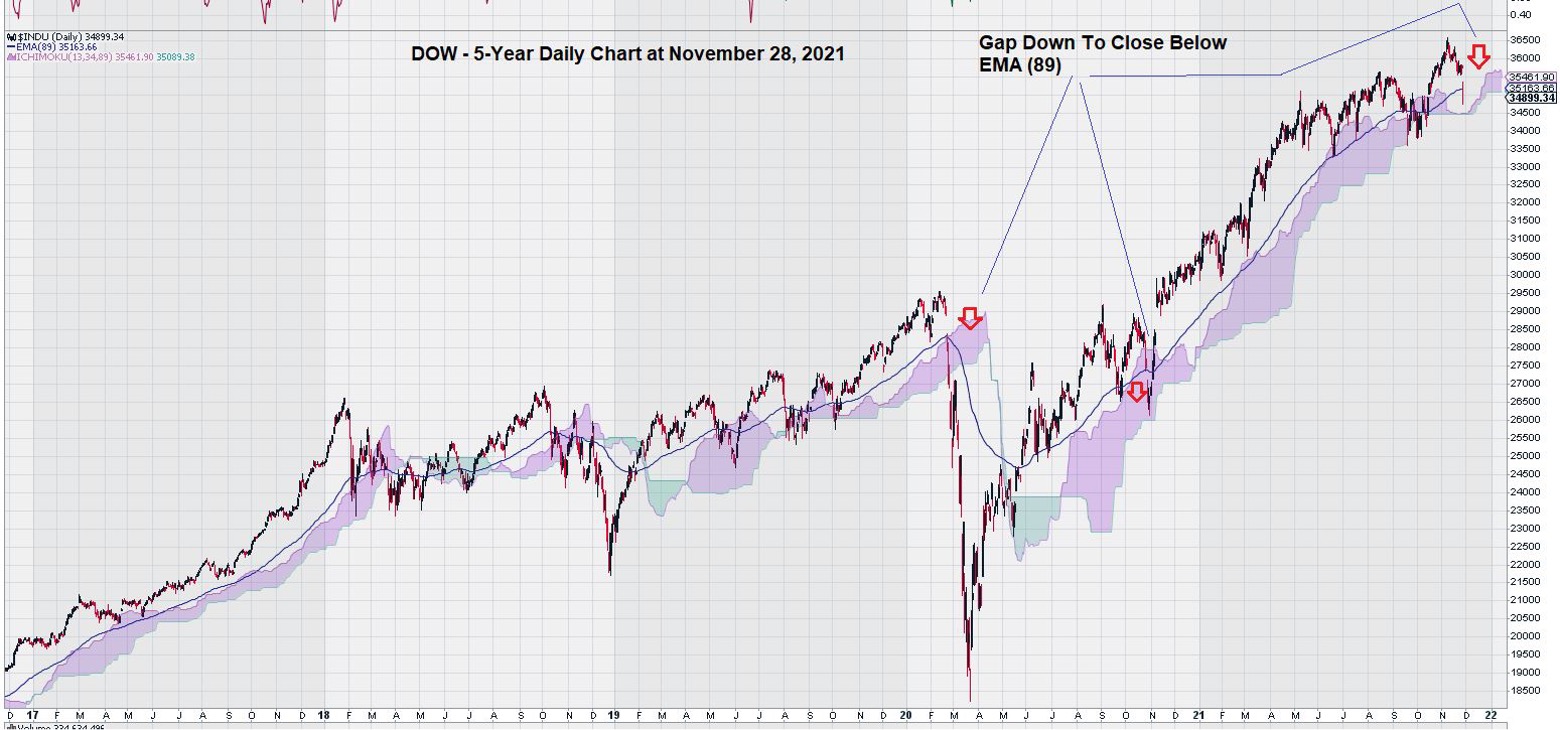
In early 2020, COVID fears weighed heavy on the market, and a significant drop followed soon afterward.
However, as can be seen by the chart, the DOW recovered quickly after gapping down in late 2020, the next time it gapped below its EMA (89). The Dow went on a tear and staged a convincing rally to establish new all-time highs.
So now what?
Traders and investors alike will be poised to strike come Monday morning.
It is shaping up to be a much-watched contest between the Bulls and Bears.
Bears will be convinced that weak Presidential leadership, FED Fear (rising rate worries), supply chain disruptions, and the potential of 70’s-style stagflation will combine to shake investor confidence and invoke selling – not to mention another round of COVID variants that are causing alarm and concern in the global medical community.
Bulls will point to the decade-long success of “buying the dips,” – so they will dismiss trading action on Friday and perhaps even for this week coming up as yet another opportunity to “buy at a discount.” Bulls will assess the many fears of the Bears and say that literal mountains of cash, including that which has been newly minted, coupled with obscenely low-interest rates, virtually guarantee that equities remain “the only game in town.”
We will keep a close eye on the DOW daily chart and report back near the end of the week.
Another factor that could quickly come into play would be declines below the Ichimoku Cloud as the “cloud cover” is dangerously thin.
– John Top, the technical trader
Note:
Regular EQUEDIA readers will already know that we rarely look at daily charts, but the DOW’s action on Friday prompted our technical analysis over this short time period.