Our daily monitoring of the DOW continues…
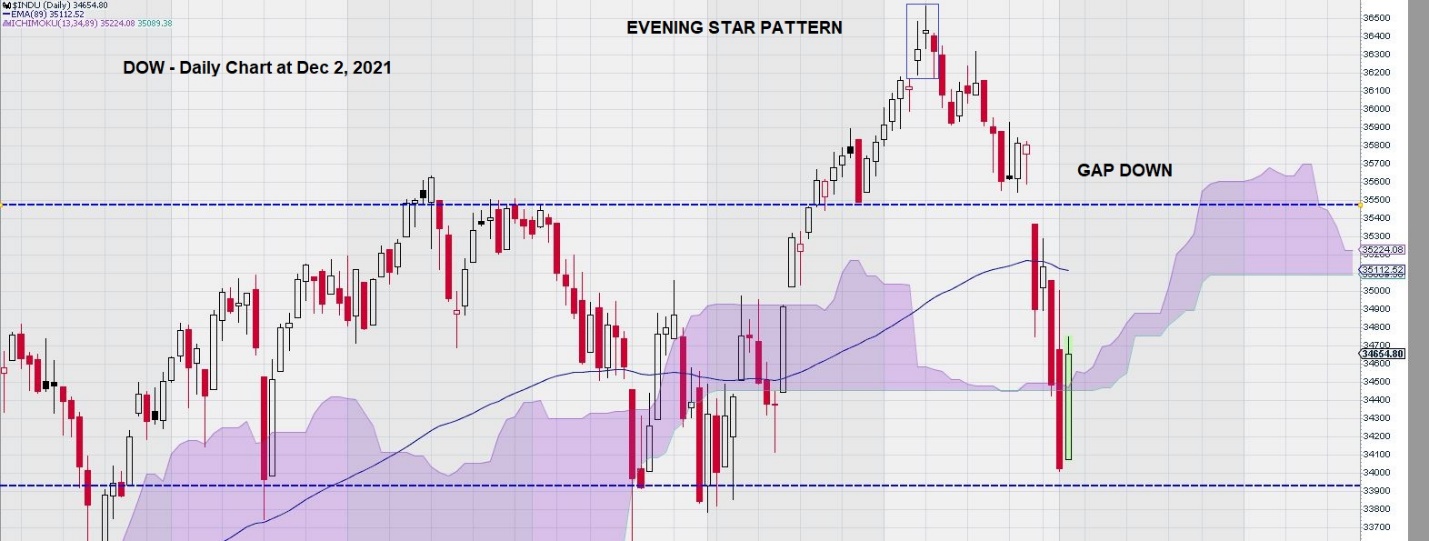
At the start of this week, we noted that the daily chart for the DOW had “gapped” lower to close below its EMA (89) on two occasions. Each had a different result. In the first case, the DOW proceeded to drop below its Ichimoku Cloud – declining from 29,500 to a low of around 19,000. The second “gap down” resulted in future trading that remained above the Ichimoku Cloud and quickly recovered from 26,500 to its most recent high of 36,500.
Today, we see that the DOW, despite an impressive gain of 600, remains below its EMA (89) and the overhead gap at 35,400 – 35,600. Trend momentum and MACD remain negative, although MACD remains above the zero line.
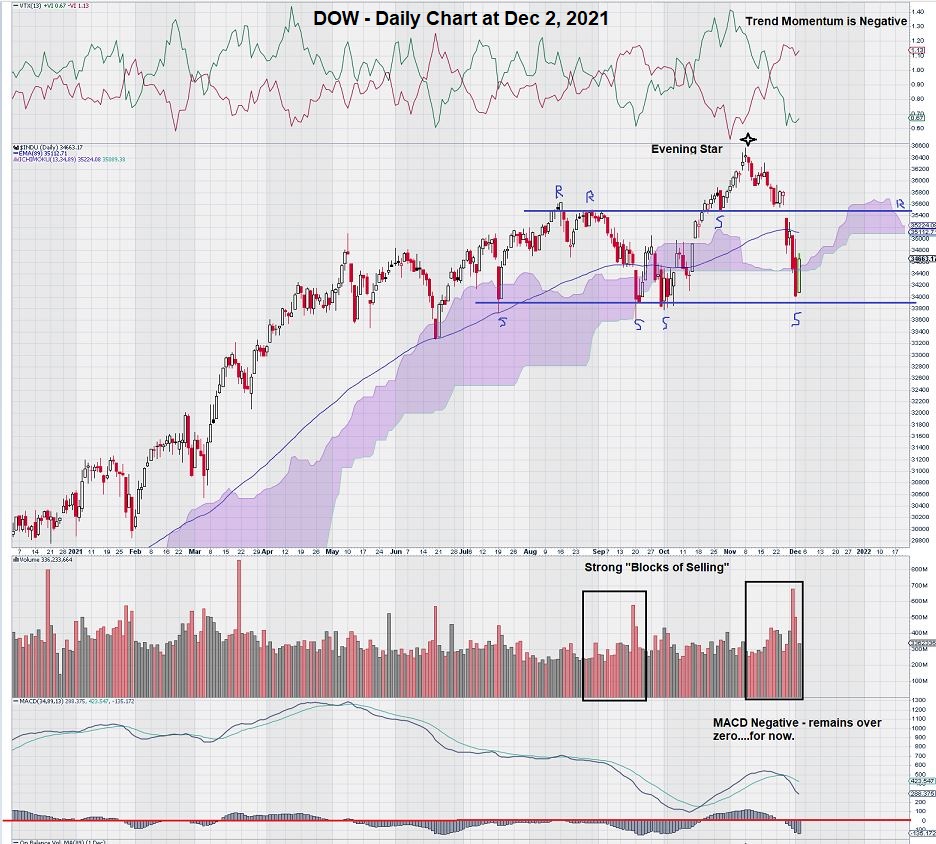
Note that there are two distinct “selling blocks” that are highlighted on the volume bars of the chart. Trading action next week will help resolve how significant this may become to the overall direction of the chart.
It is worth noting that the recent high of the DOW resulted in an Evening Star Pattern. This pattern can be interpreted as a reversal signal, particularly when it comes after a strong series of consecutive advances. The DOW daily chart is a good example of this pattern.
For more information on “Evening Star Patterns,” see searches for various websites that describe it more fully – for example, here.
Here is a closer look at the Evening Star Pattern on the chart:
Summary & Wrap-Up
Based on the close last Friday, we had a hunch that trading this week would reflect the diversity of views held by Bulls and Bears.
We were not disappointed as there has been a transparent struggle for control of the market. As a result, both the Bulls and the Bears can claim victory for individual days.
So, where does this leave the daily chart for the DOW?
Chart watchers are ever mindful of a particular chart pattern that can spell the end of a long, sustained upward rally. This pattern is the “Orthodox Broadening Top.”
It is NOT PRESENT in the daily chart for the DOW.
This pattern forms when, at the end of a long upward rally, we start to see higher highs and lower lows that result in an open “fan-like” pattern. That is why it is useful for the DOW to “hold the line” on some of its declines.
There is support for the DOW at 33,800.
Future trading that would result in consecutive daily closes below this support level would likely lead to further declines.
In addition, it would then remain as a key resistance level for subsequent advances.
– John Top, the technical trader