Investors Wary of A Hole in the FED’s Punch Bowl
Last week, we noted the Dow Index (DJIA) was gapping below its EMA(89) and seemed likely to dip below its Ichimoku Cloud. We pointed out that this had occurred twice before on the Dow daily chart with mixed results afterward.
Let’s see how the Dow performed over the past week.
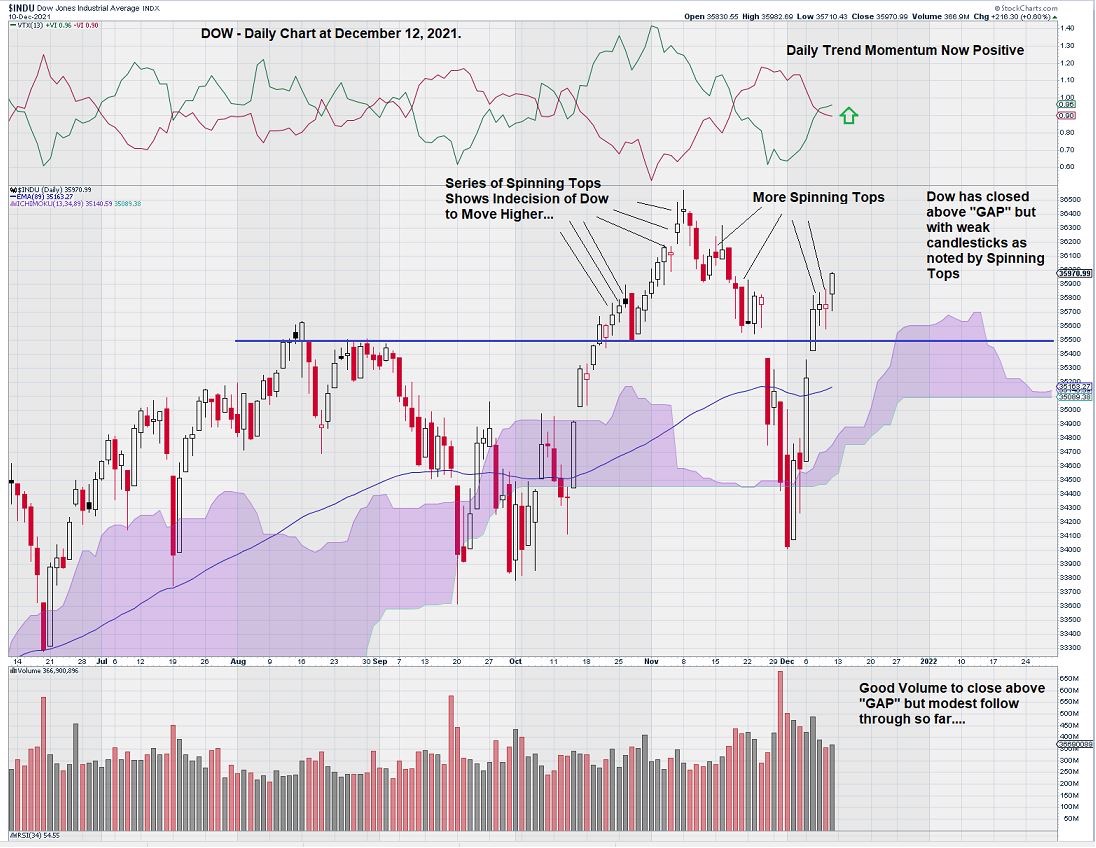
On the daily chart shown above, we note that our trading instincts were correct; the Dow continued to decline below its EMA(89) and then tested the base of its Ichimoku Cloud with a one-day close below it.
Candlestick charts can often reveal aspects of the way something trades that may otherwise be missed. Take our daily chart for the Dow as an example.
We see a key level for the Dow at 35,500. The daily candlestick chart shows a “concentration of indecision” above this level.
Almost 1/3 of the daily candlesticks above 35,500 are Spinning Tops. These candlesticks show that investors have weak conviction at this price point. In a word, they remain undecided.
There is some positive news for the Bulls. Daily Trend Momentum is now positive, although MACD (not shown) is still weak and remains such that the signal line is below the trigger line.
Trading volume was positive to lift the DOW above 35,500, but follow-on volume has resulted in weaker candlesticks, including a spinning top.
Summary & Wrap-Up
The daily chart for the DOW has continued to rise since the end of October, when it started to make new all-time highs. But these new highs have come with investors who remain increasingly wary of the future.
Candlestick charting allows the painting of a visual picture. The “picture” we see for the DOW, with a series of Spinning Tops, is telling us to take a step back and reassess any bullish sentiment that we may have in the future as well. Traders already know that caution will save us from more missteps than it will result in us forgoing opportunities.
Perhaps the series of Spinning Tops are an omen of market headwinds in the New Year. Are some investors noticing a “Hole in the FED’s Punch Bowl”?
– John Top, the technical trader