Facebook Selloff Preceded by Fibonacci Derived Trading Signal
(Educational Segment 026)
The long-term weekly chart for Meta Platforms, Inc. (Facebook or FB) (NASDAQ: FB) gave a “teachable moment” when it comes to understanding how real-world charting (technical analysis) works.
Let’s start by taking a look at the weekly chart for FB from the very start of trading:
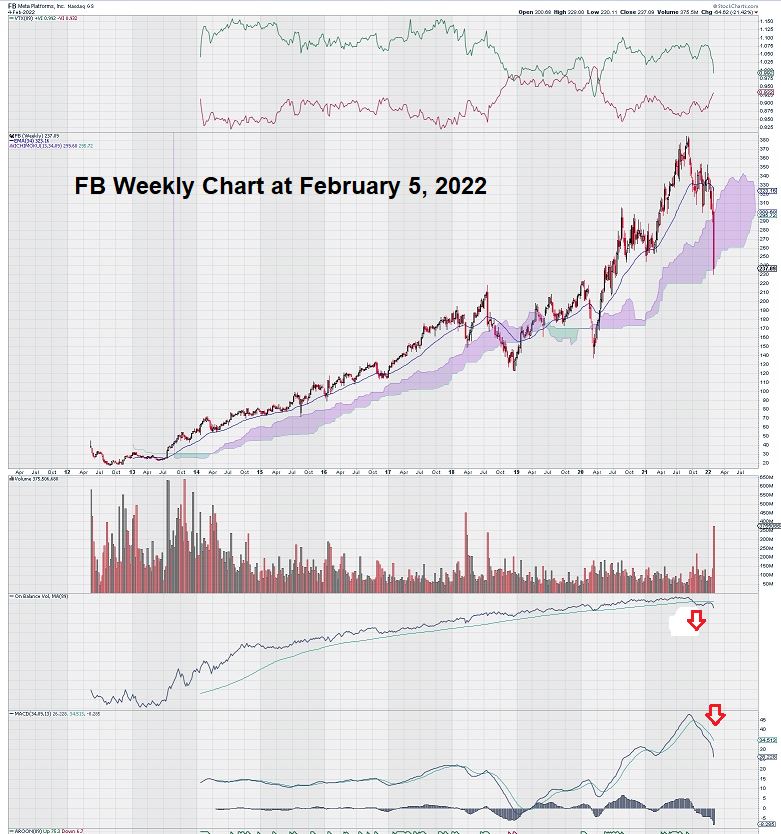
Note that below the volume bars, OBV(89) shows a decline below the trigger line for the first time since 2012, when FB began trading.
This signal is too strong to ignore.
Why do we make such a decisive statement?
The answer lies in comparing OBV(89) with MACD(34/89/13).
During the last decade, MACD had numerous cross-overs and even declined below the zero line in early 2019. Yet, despite these numerous cross-overs, OBV remained “rock solid” – never declining below its trigger line. This kind of trading action tells us that traders were of a mind to “buy the dip” when they occurred.
Some definitions of On Balance Volume use this term: “a measure of crowd sentiment.” We would agree. This is a good way to think of OBV.
That is precisely why, when our Fibonacci derived trading signal (which uses 89 weeks to create a moving average trigger line) told us that this time was really different!
Unlike all of the other times when the share price, and later MACD, declined, this time OBV declined as well. What did this mean?
The “crowd” had turned on FB. There were not enough buyers of the dip to keep sellers at bay.
You might even say that FB had its own “Minsky Moment .”Once the market recognized that the bears were taking over the FB market, it seemed that buyers became progressively more hesitant. Two rallying attempts were made by the bulls but they were both rebuffed by the bears.
Later, when the bears were in full control of the FB market, we saw the outsized, long red candlestick.
Here is a better look at the carnage inflicted on FB by the bears:
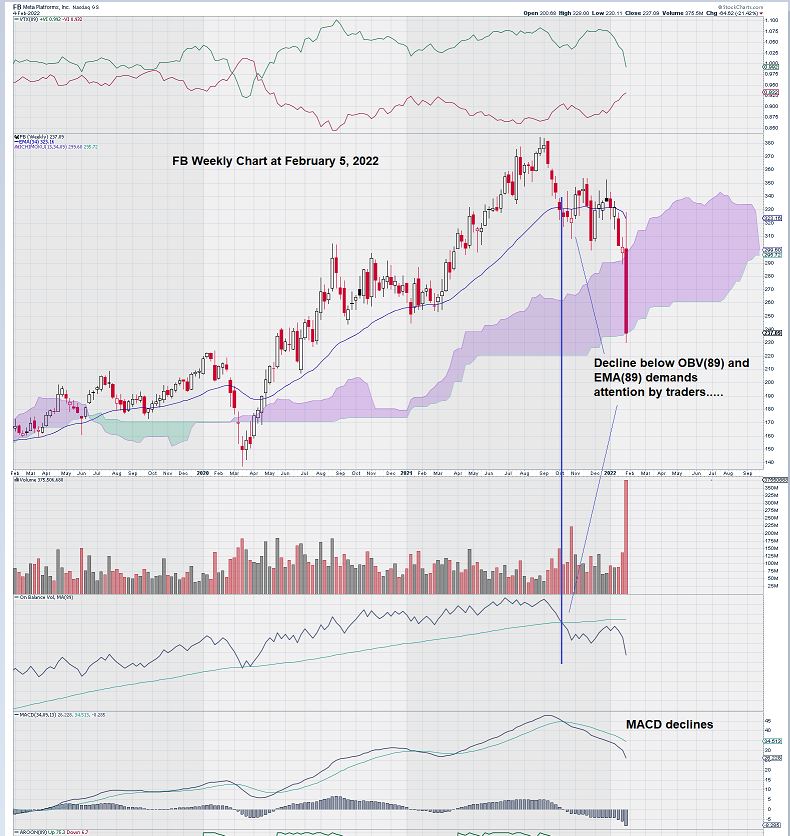
This 3-year weekly chart gives a much better visual definition of how the decline in OBV(89) was one of the best trading signals we have come across in quite some time.
Ironically, the signal was given in October 2021. Seasoned investors and traders remember another October….in 1987 when the stock market experienced a one-day decline of 20%. For FB, there was a slow fuse reaction – sell signal in October, followed by a 26% one-day decline in February.
Summary & Wrap-Up
Today’s trading review of FB is another example of why we tend to concentrate on longer-term “trend analysis .”Our “charting comfort zone” is with weekly charts that stretch out to include about a year and ½ of data.
Regular EQUEDIA readers know that we rely on Fibonacci numbers in our chart settings to give us trading signals that can be relied upon
The chart for FB prompts the question: “Are there any other charts that look like this?” Simply put “89” into your weekly OBV setting and see for yourself.
Techies will create a screening program to expedite this process.
Good luck in your search for other trade candidates.
– John Top, the technical trader