
The monthly chart for gold reveals some interesting signals that take a long time to complete. This means they are worth looking at closely. We will focus on some key lower support levels for gold and examine an oscillator that our Equedia readers have not seen used much.
The technical oscillator for the monthly gold chart that may prove to be “worth its weight in gold” is TRIX. TRIX stands for “the percent rate of change of a triple exponentially smoothed moving average.” TRIX has a very strong feature to it: insignificant price movements are filtered out.
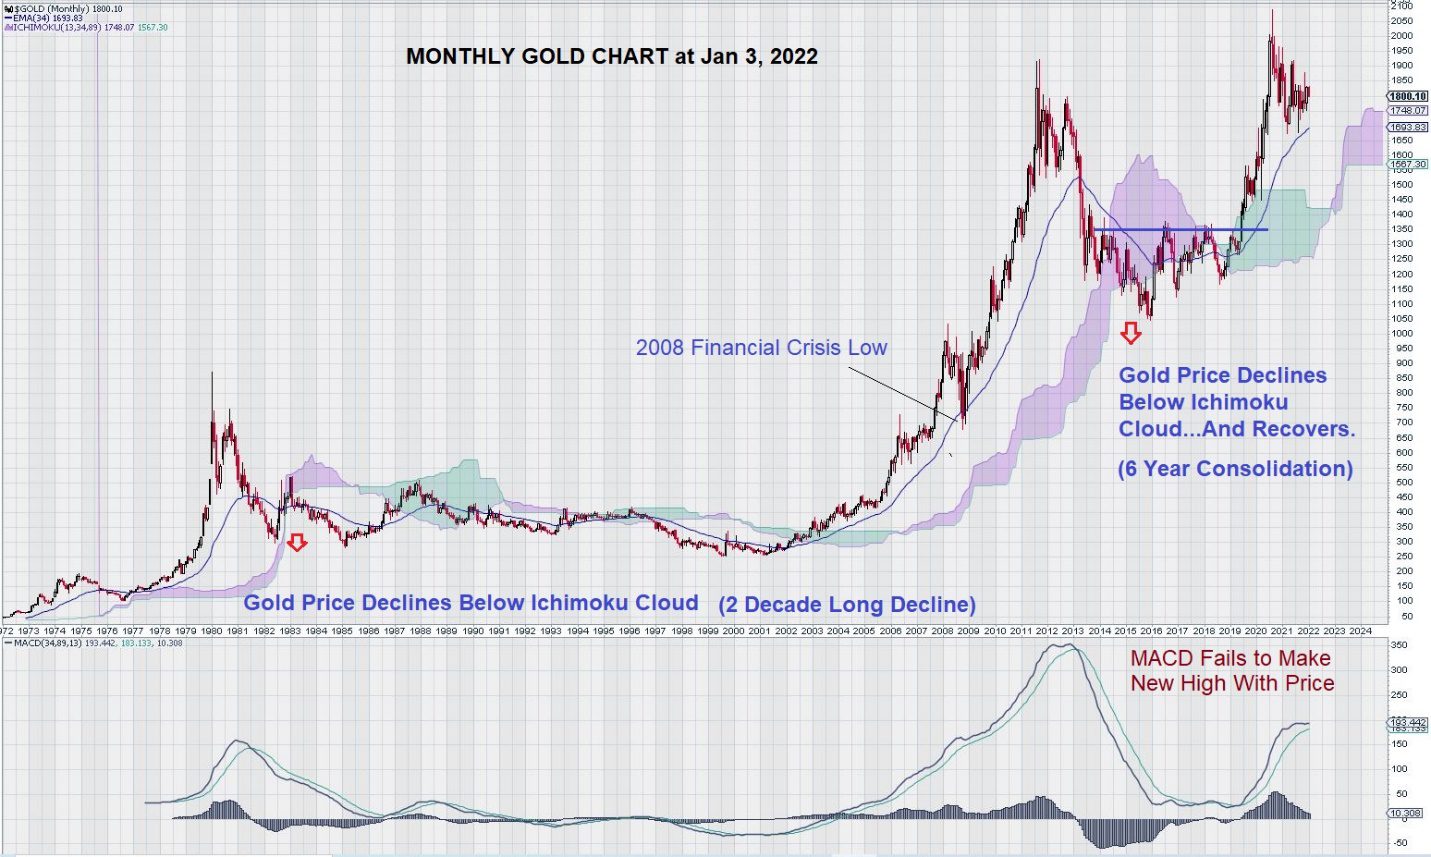
Here is the monthly chart for gold:
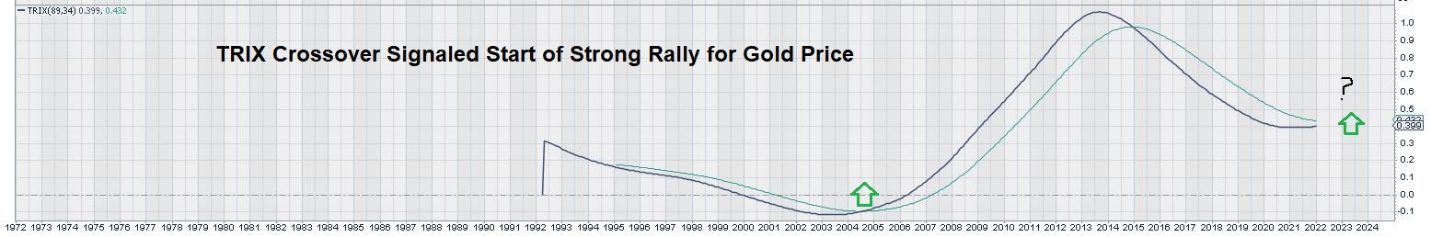
Separately, here is the TRIX oscillator for the same time frame:
Let’s start by looking at how the monthly gold chart reacts to the Ichimoku Cloud.
First, we remember that the “gold window” was closed in mid-August 1971, in response to a request by the government of France to convert a significant quantity of $USD back into gold. Nixon denied the request, and the price of gold started to climb, spiking to over $850 in 1980.
A few years later, in 1983, the price of gold declined below its Ichimoku Cloud and started a long (some might say “tortuous”) multi-decade decline. The decline in the gold price ended just as a new millennium began.
By 2004, gold had recovered to trade above $400. We note with great interest that TRIX gave its one and only crossover buy signal for gold at this time.
TRIX also gave a sell signal in 2015. Although the price of gold did decline further, it recovered quickly. This is because the TRIX signal comes later than MACD by at least a couple of years.
So why spend time looking at a signal that is so late?
What value does it have? These are obvious questions that need to be answered.
Currently, gold has not shown the conviction necessary to challenge its most recent high and move beyond. In part, there is a prevailing view put forth by large investment banks (most recently by JP Morgan – yes, the same JP Morgan that was assessed fines and penalties for “spoofing” and manipulation of the gold market) that gold will come under pressure in 2022 as the FED attempts to raise interest rates.
Gold is responsive, in the inverse, to the $USD. Higher rates support the case for a stronger $USD and, thus, a weaker gold price.
This is precisely why we may get the signal we need from TRIX.
The reaction to a rising rate environment and implied stronger $USD will leave its mark on the gold price. TRIX, used in the context of monthly charts, on trend settings, means that the impact of week-to-week and month-to-month price fluctuations become smoothed over time. This will include any downward moves in gold due to a stronger $USD.
So, as we look ahead, rather than getting caught up in each new “reason” that calls for a lower gold price, perhaps it is simply best to keep a steady watch on TRIX. TRIX will tell us when the market will finally put all the negative sentiment of gold behind it and start a new journey upwards.
The first and only signal from TRIX gave a very positive entry point for a gold trade at $400. Recall that gold had nearly doubled from its low before the signal was given. Subsequently, gold rose nearly 5x to over $1850.
Our monthly chart analysis highlights two underlying support levels for gold at $1550 and $1350.
Summary and Wrap-Up
TRIX, an exponentially smoothed exponential moving average, gave an excellent entry point for gold trades back in 2004.
It has not given another buy signal since.
TRIX has flattened considerably in 2020/2021 and may be getting ready to speak once again.
When it does – we are ready to listen.
– John Top, the technical trader