


Interpreting the TSX Gold Index Using Aroon
(Educational Segment 025)
We begin the New Year by re-visiting another uncommon technical indicator. It is based on a different premise than most other momentum oscillators that provide various measures of price changes versus time. Aroon looks the other way. It is unique because it highlights time relative to price.
This feature of Aroon means that technical chartists can use Aroon to identify emerging trends and anticipate reversals.
It can also be used to confirm consolidations and corrections found using other chart-identifying methods.
Before we get too far along in our study of the Aroon indicator, it may be helpful to consider how it was named. Aroon is an ancient Sanskrit word that translates to: “Dawn’s Early Light.” So, you see, it is clever way to name this indicator because it is focused on time relative to price. Aroon “senses” when momentum shifts occur. This is particularly important when the momentum shift occurs after a long, stable period where either positive or negative sentiment is dominant.
The Aroon indicator consists of two parts: Aroon UP (Green) and Aroon DOWN (Red). These indicators fluctuate above and below a centerline (50). They are bound by zero (0) and one hundred (100).
Bullish control of a market is signaled when Aroon UP is over 50 and Aroon DOWN below it. This makes sense intuitively because when Aroon UP is over 50, it means that there are a greater number of new x-day highs than lows. Typically, Aroon “x” has a value of 25 when it is used in daily charts.
Prices move consistently higher when Aroon UP remains in the 70 – 100 range for extended periods. Again, this is an easy concept to grasp; a successive series of new highs keep Aroon UP at a high level, due not to price but rather to time.
In our analysis of the S & P TSX Global Gold Index, we will “stretch out” Aroon and see if long-term settings can allow for any meaningful observations on the weekly chart.
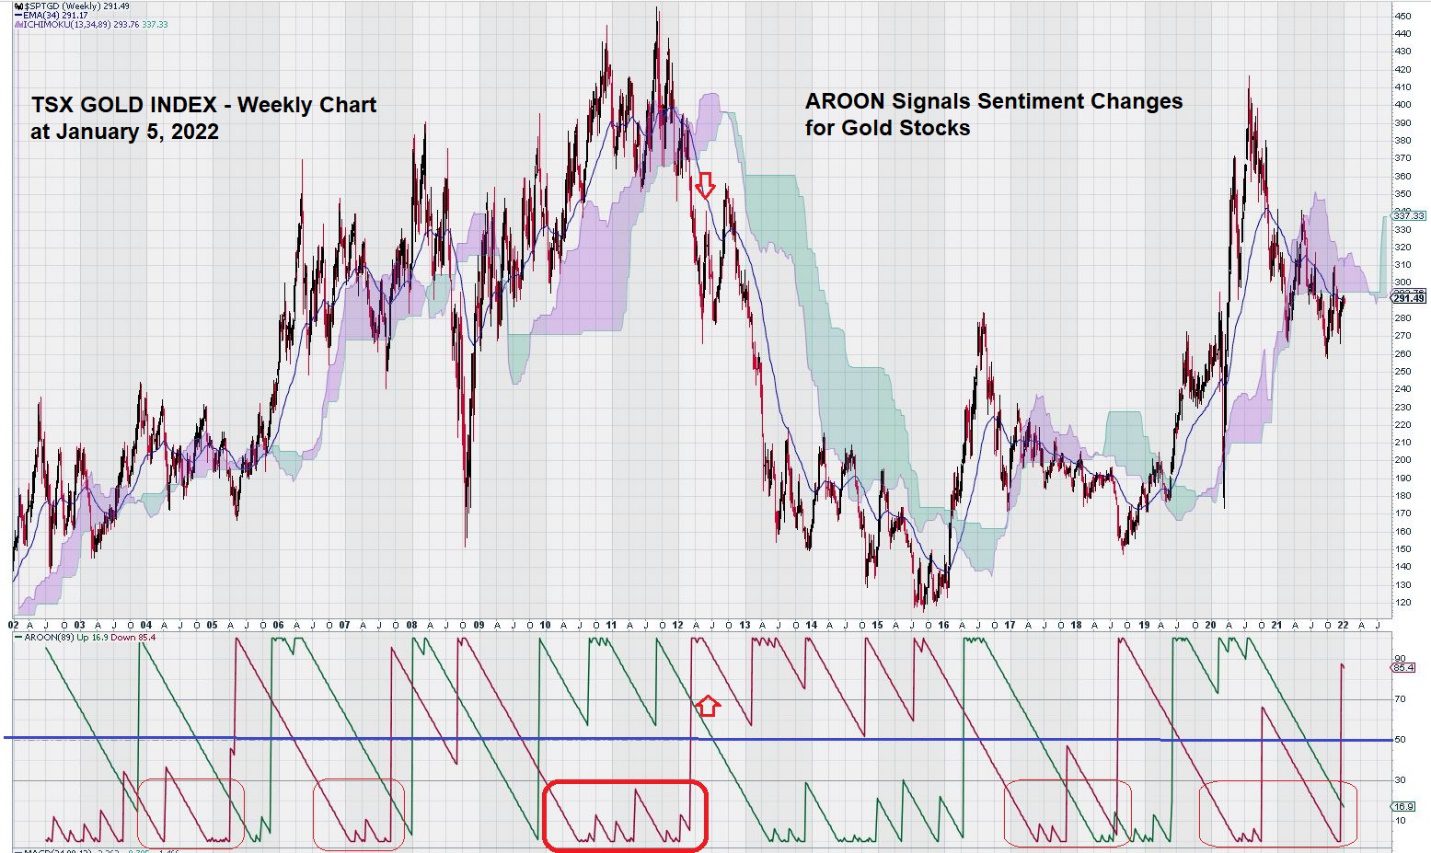
The area highlighted in bold Red shows Aroon Down for the period 2010 – 2012 (Feb). Aroon Down remained under the 30 level for this period.
This is where the Aroon indicator (using unconventional settings) gives us a very early warning that the decade-long advance of gold stocks might be facing some downside pressure.
How do we know this from looking at the chart?
First, we see a very typical set-up for Aroon during a sustained uptrend. We note that Aroon Down remains low at under 30.
Second, we also see that, for the most part, Aroon Up is above 70. This is to be expected when, over time, the market is being fueled by successive, new highs.
But then…
A cautionary warning appears in the form of Aroon Down suddenly and sharply reversing and crossing over Aroon Up at a high level, above the 50 level, and almost above the 70 level. What does this mean?
It means that the positive sentiment that was keeping the gold stock rally going suddenly vaporized. It did not recede gradually – it ended!
This brings to mind the very definition of the “Minsky Moment” – something that we have mentioned in previous chart studies.
The TSX Global Gold Index dropped from around the 380 level to 280 during mid-2012. For the balance of the year and into 2013, it made several attempts to recover lost ground – even having a weekly close at the 350 level. On the third decline to the 280 level in early 2013, we were reminded of the trader’s adage: “Three Taps and Out.”
After three consecutive declines to the 280 level, the TSX Gold Index started a multi-year decline in February 2013. The decline in gold stocks was accelerated a few months later, in mid-April, when gold lost over 9% of its value after 10 million ounces of “paper gold” were aggressively sold on the COMEX.
The question is: “What, if anything, can we learn from a study of Aroon, as both gold and gold stocks enter 2022”?
Let’s retake a look at Aroon to see how we answer this question.
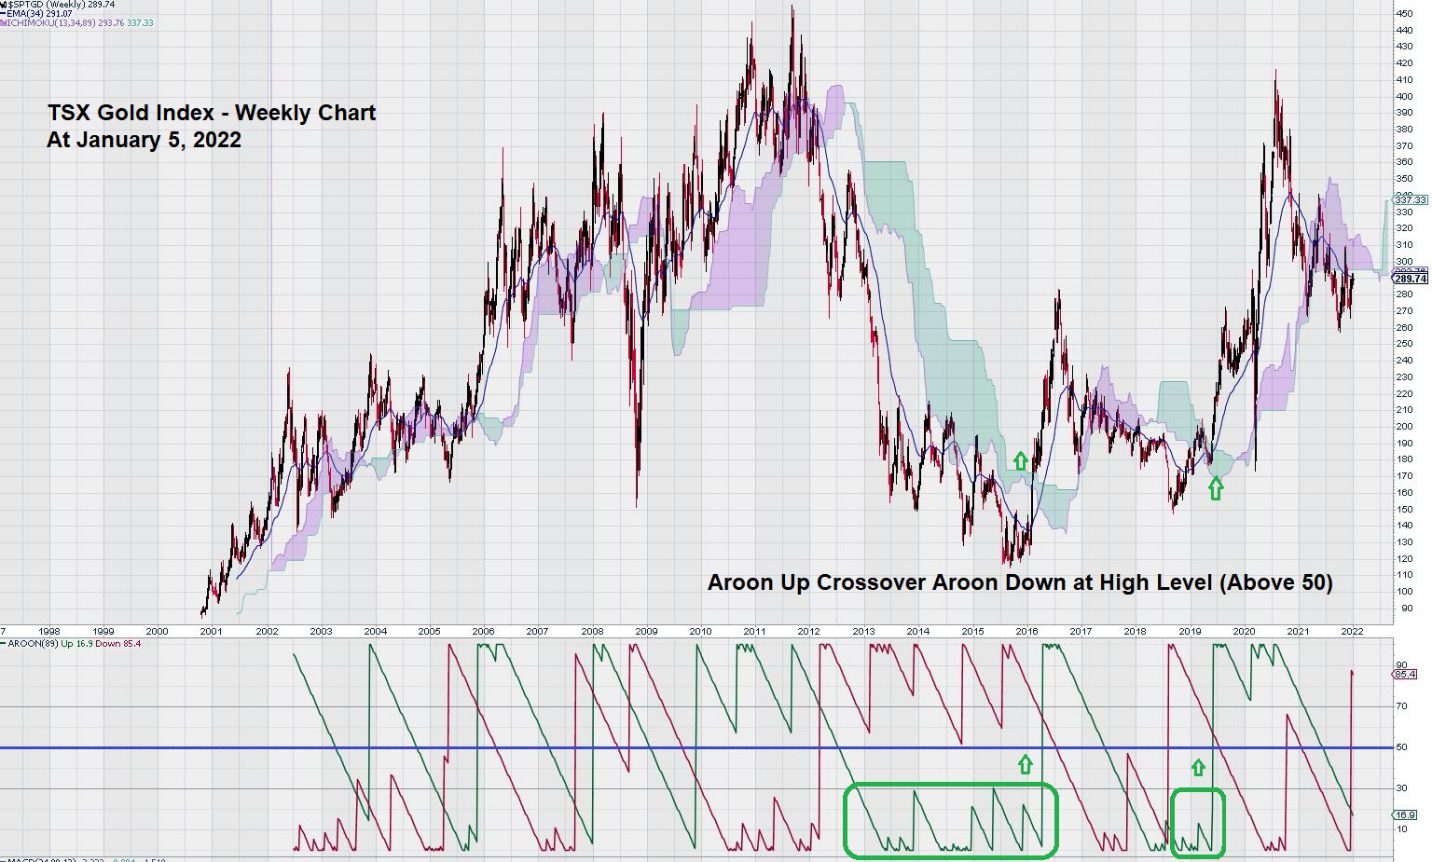
The decline in gold stocks that began in 2012, which accelerated in 2013, ended in late 2015 (the TSX Gold Index fell to the 120 level). It was confirmed to be over early in 2016 when Aroon Up crossed over the 50 level and then over Aroon Down at just below the 70 level.
Another buy signal was generated from Aroon in mid-2019, again after gold stocks retreated all the way back to the 150 level.
At the end of 2021, we note that Aroon Down (Red) crossed over Aroon Up (Green) and then crossed over the 50 level. We also see that MACD is at an inflection point at the zero line. MACD appears set to move below it, a negative indication.
How does the action of Aroon Down at the end of 2021 compare to other similar chart set-ups over the life of the chart?
Take a careful look back, since inception, at the TSX Gold Index. Focus your attention only on Aroon Down (Red).
The Aroon Down crossover signals that occurred when Aroon Down crossed over Aroon Up, when Aroon UP was at a low level (30 level), reflected weakness in the price of gold stocks that (in the context of the chart) was temporary. In other words, this condition of Aroon confirmed periods of consolidation.
This is what we see today.
Aroon Down is crossing over Aroon Up at a very low level.
As a side note, it is useful to explain how Aroon Down behaved during 2008. The “2008 Financial Crisis Interruption” caused Aroon Down to cross over Aroon Down at a high level (70 level). This crossover is unique because Aroon Down did not reverse to a low level (30 level) prior to the signal.
We repeat:
The decline in gold stocks that began in 2012, which accelerated in 2013, ended in late 2015 (the TSX Gold Index fell to the 120 level). It was confirmed to be over early in 2016 when Aroon Up crossed over the 50 level, and then over Aroon Down at just below the 70 level.
This is very important for our EQUEDIA readership to understand.
We have taken an exhaustive, all-encompassing study of the Aroon technical indicator on the weekly chart of the S & P TSX Global Gold Index.
This study clearly shows that the technical chart set-up that “ended” the decade-long rally in gold stocks in 2012/2013 has not been repeated in 2022.
Summary and Wrap Up
We are not suggesting that gold stocks are set to begin another sustained advance. Our chart of the TSX Gold Index says otherwise. Further weakness in gold stocks seems more likely than not.
The underlying robust and supportive sentiment for gold stocks may have ebbed to a low, but it remains intact. Since the low of 120 at the end of 2015, the TSX Gold Index has made a “higher low” at the 150 level.
Our expectation is that another “higher low” will be made sometime in 2022/2023. There is both “time and room” on the TSX Gold Index chart for the current consolidation to continue to seek out that “higher low.”
We recognize that in the short term, gold and gold stocks will face headwinds from the actions of the FED. Reductions in the bond-buying programs, the slow and careful upward adjustment of interest rates, and, ultimately, the reduction of the FED’s balance sheet are all widely understood to be their goals.
The FED understands that it must move cautiously to avoid, as much as possible, causing the US economy to go into recession or much worse.
Gold and gold stocks will respond to the success or failure of the FED as it attempts to implement its policies in an effort to slow inflation that it once viewed as “transitory.”
Supply chain disruptions, COVID, and global geopolitical tensions have come to bear on various economies of the US and its trading partners. The FED must weigh all of these considerations as it carries out its monetary policy agenda.
Gold and gold stocks remain responsive to any “missteps” by the FED as it seeks to end a historic and lengthy period of accommodation.
– John Top, the technical trader


What is your prediction for the price of shares of CXB.TO?