
Two weeks ago, we noted that the weekly chart for BITCOIN had some technical concerns that were likely to be resolved to the downside.
Our chart showed that $42,000 was the Fibonacci support level, by using the rather unorthodox approach of taking a “Fibonacci Snap-Shot” using neither the absolute high or low. In effect, we “made” the Fibonacci Retracements “fit” the chart.
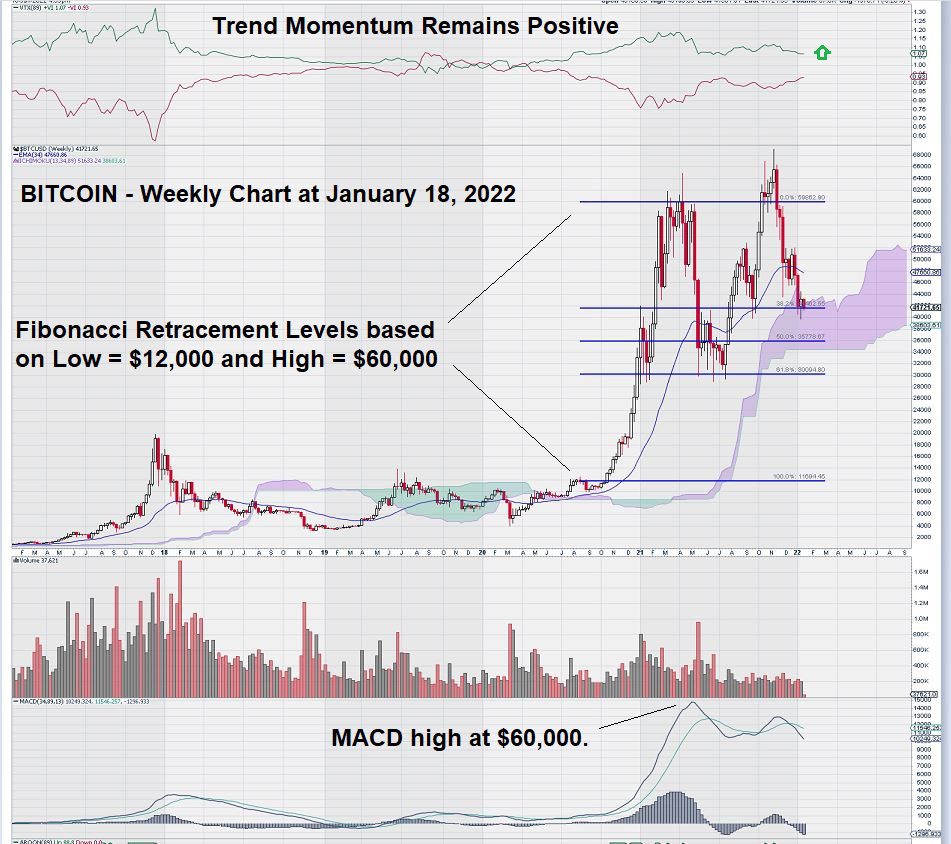
This odd approach to chart construction identified the $42,000 level as a key level. As more time passed, this derived level of chart support proved valid. BITCOIN subsequently gave way and traded lower.
Now, we take another Fibonacci Retracement review of BITCOIN using a Fibonacci set-up that we have applied to the weekly gold chart.
Here is what the weekly chart for BITCOIN looks like today:
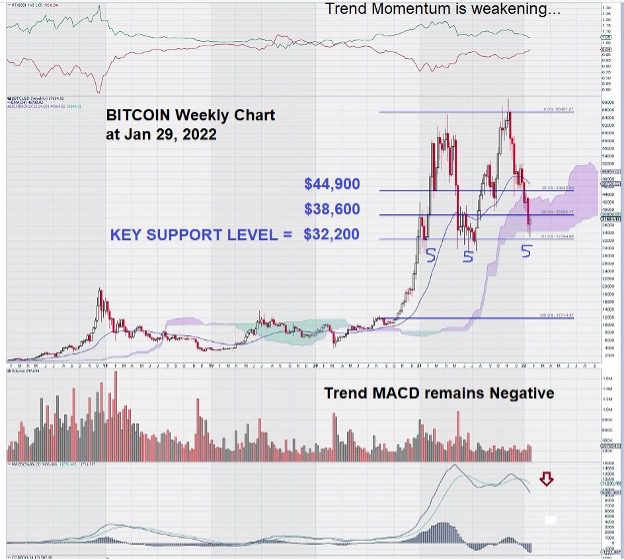
The current weekly chart for BITCOIN shows how it is in a rather precarious position – trading just above the $32,200 level.
Why do we use the word “precarious”?
- MACD is negative and shows no signs of flattening.
- We see negative divergence between MACD and the price chart. MACD is not making a new high with a new high in price. Trend Momentum is still positive but is weakening.
- BITCOIN price is testing the lower limit of its Ichimoku Cloud.
- The $32,200 level is a key support level that has held twice in the past. Looking ahead, could we see “Three Taps and Out”?
- Look out Below!!! Below $32,000, the next significant chart support level is $12,000.
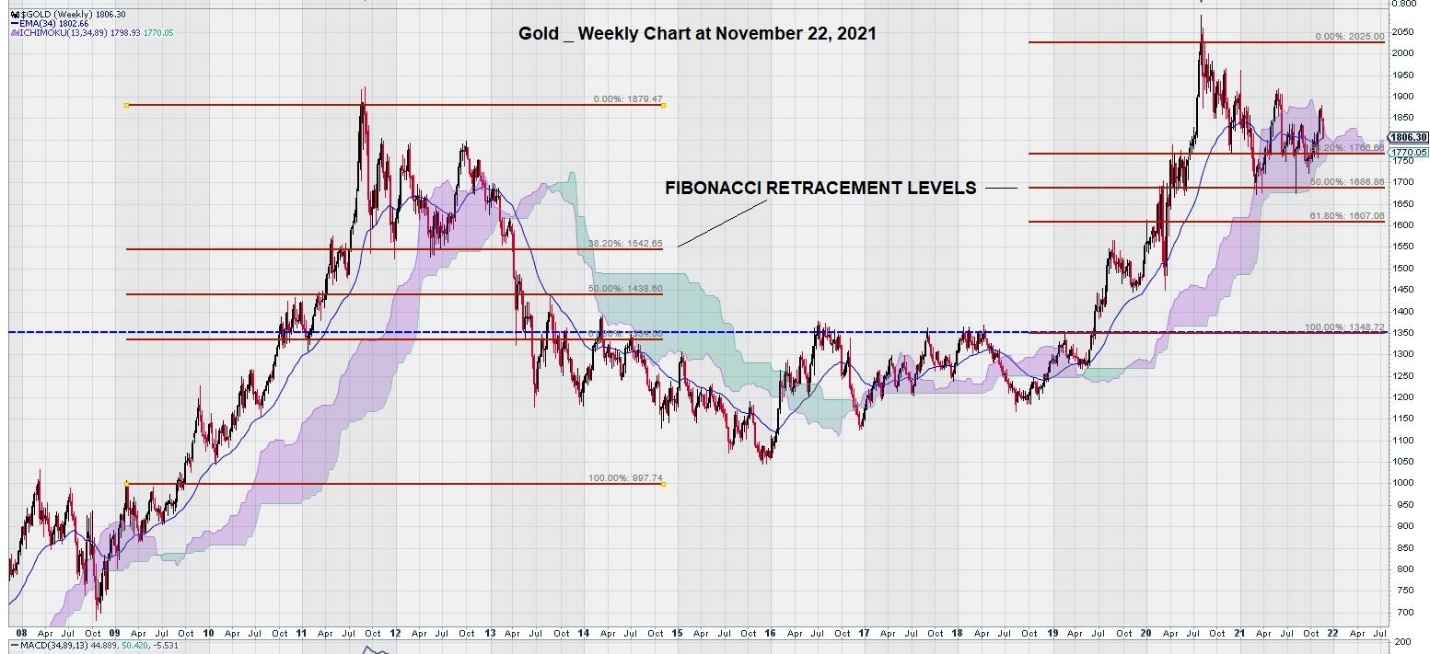
In our most recent weekly chart for gold, we did the same thing to come up with our Fibonacci Retracement levels. Note that in the first Fibonacci study we used $1,000 as our low and $1880 as our high. In the second Fibonacci study we used $1350 as our low (remember this level was a 6- year resistance level) and $2025 as our high.
Summary and Wrap-Up
As noted in our last article on BITCOIN, we are neither a fan nor a detractor. For us, charting BITCOIN and applying standard methods of technical analysis to it is a challenge that we gladly assume.
Our “trading instincts” sensed weakness for BITCOIN as it fell below $42,000.
We are even more sharply attuned to the current level of support at $32,200.
– John Top, the technical trader