
Silver Continues to Consolidate Within its Ichimoku Cloud
Today we review a previous weekly chart for silver and update it with some new ones.
First, a look back. Our chart from last November highlights the $28.00 level as a key level for silver:
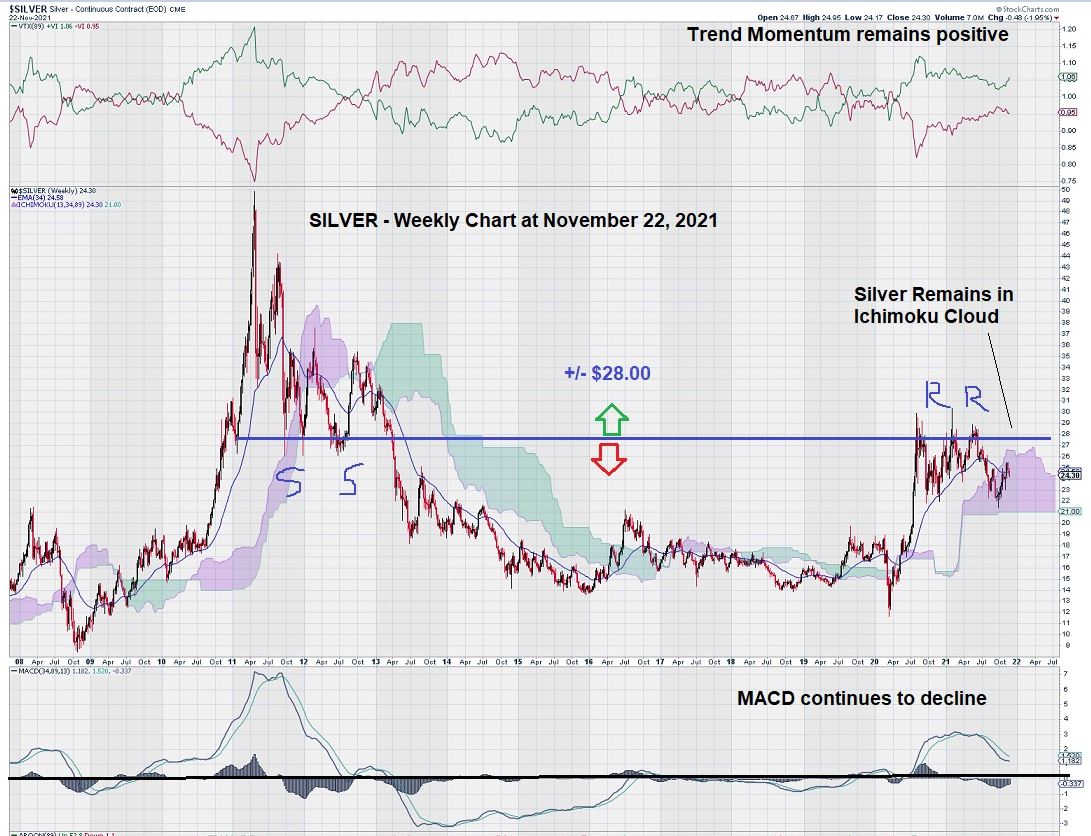
As we know, silver has not crossed this critical chart threshold yet. It should be noted that the horizontal line drawn at the $28-level represents an internal support/resistance level on the chart. Regular EQUEDIA readers will remember that we like to call these internal support/resistance levels the “spine” of the chart.
Let’s take a further step back from the weekly chart for silver and see if we can gain any other insights into future price direction and timing.
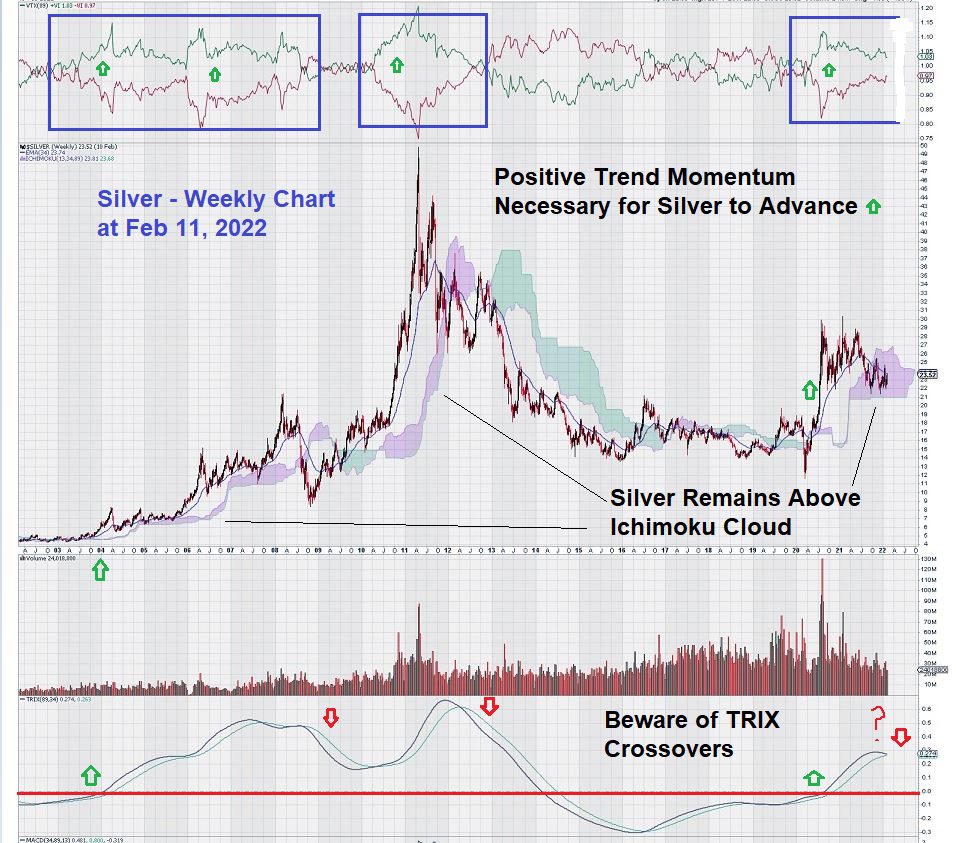
In this current silver chart, we see that positive trend momentum is necessary for silver to advance. Trend momentum remains positive.
Silver remains in “no man’s land.” It appears to be consolidating within a defined range of $22 – $28.
Some mixed technical signals make the weekly chart analysis for silver a tricky read. Let’s review them.
First, we see that there are positive signs.
Silver remains comfortably within its Ichimoku Cloud, which has a lower level of $21. Also, as noted on the chart, trend momentum (upper banner on chart – green over red) remains positive.
Then, we see that TRIX, a triple-smoothed exponential moving average, has only crossed over the centerline twice – in 2004 and again in 2020. Silver bulls will remind us that in 2004 silver averaged around $6.50 and subsequently had a high of just under $50 in 2011.
Our chart shows the TRIX crossover at the recent price high of $28 due to the “lateness” of the signal – based on our choice of 89/34 as our signal and trigger values. Is silver headed to a level that most people would find beyond belief in the years ahead?
Now, let’s “put the brakes on” our newfound silver enthusiasm.
Like two sides to the same coin, some indications in our silver chart can be viewed through a negative lens.
For example, although we noted that TRIX has crossed over the zero line, it’s now testing our resolve because the signal line is starting to flatten and get closer to the trigger line. See the far-right edge of the chart where we note with a question mark.
Let’s now turn our attention to MACD on trend settings:
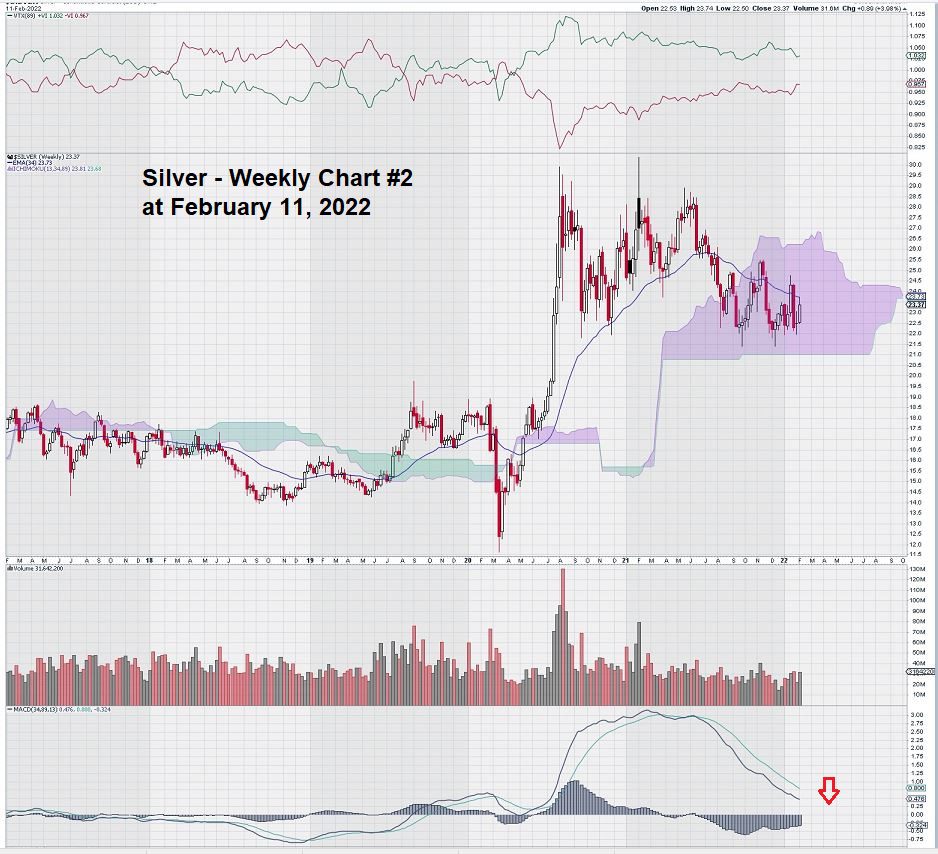
We see that MACD continues its descent; the signal line is well below the trigger line, and both lines seem likely to test the zero line.
Summary and Wrap-Up
The weekly chart for silver has shown great resilience at the $22 level. By our count, we see that it has tested it at least four times. Over the past two years, it has proven to provide a strong base of support.
Additionally, the Ichimoku Cloud has a sharp, well-defined base at $21.
We are content to let the chart “do the talking” and simply “wait it out.”
More aggressive traders may want to consider drawing a trend line on the Commodity Channel Index indicator that is now almost in “buy territory” as it approaches -100. A week-by-week review of the Friday candlestick that “makes” the weekly chart may also provide some clues about future price action.
Cautious traders can simply wait on the buy signal from a positive MACD crossover and perhaps a crossover of the zero line or a break-out back above the Ichimoku Cloud, followed by taking out the $28 overhead resistance level.
We have not looked at the daily chart for silver but would suggest that active traders may want to consider using Williams %R and Slow Stochastics to trade silver while it remains in a “box range.”
– John Top, the technical trader
Disclosure: We own both silver and silver stocks.