The financial system is going through a paradigm shift.
In the past few months, we discussed striking changes in policy, the economy, and markets that are shaking up the status quo set decades ago:
- The growth of the Fed’s powers
- The dangerous mix of the most overleveraged economy in history and overpriced assets
- The highest inflation since the ’70s—which, contrary to what policymakers have told us, is not a “temporary” hiccup
- Supply and demand in shambles
- The introduction of CBDCs, a more centralized sovereign currency than fiat
These stories received many responses and questions from you. But essentially, they all revolved around a single concern:
“How do I shield and invest my money in this regime?”
In this two-part series, I’ll address investing in the challenging environment we’re in. We’ll go over each major asset class—including gold, real estate, even crypto—and “war game” their role in this paradigm shift.
Spoiler: there will be no definitive answers. There’ll be no “invest in this or that.” That’ll come soon, but it’s important to know the macros. Which is why this series will give you plenty of food for thought to make your own investment decisions.
So, let’s get started by recapping where we are today.
The Monetary Rock Bottom
Do you remember what things were like prior to Covid?
In 2019, CNBC pundits whined about 2% rates and swelling balance sheets. Today, the Fed’s balance sheet has more than doubled since then.
If you think monetary policy was a failure then, we’re a sickening disaster now.
There’s an important lesson here: just because you get used to easy money, it doesn’t mean it’s okay. And as we’ve discussed many times, we got a little too complacent about numbers that go well into 13 figures.
How complacent?
Since the beginning of Covid, the world’s four major central banks have printed over $11 trillion. The Fed churned out $4.5 trillion of those…which accounts for one-fifth of all dollars in existence!
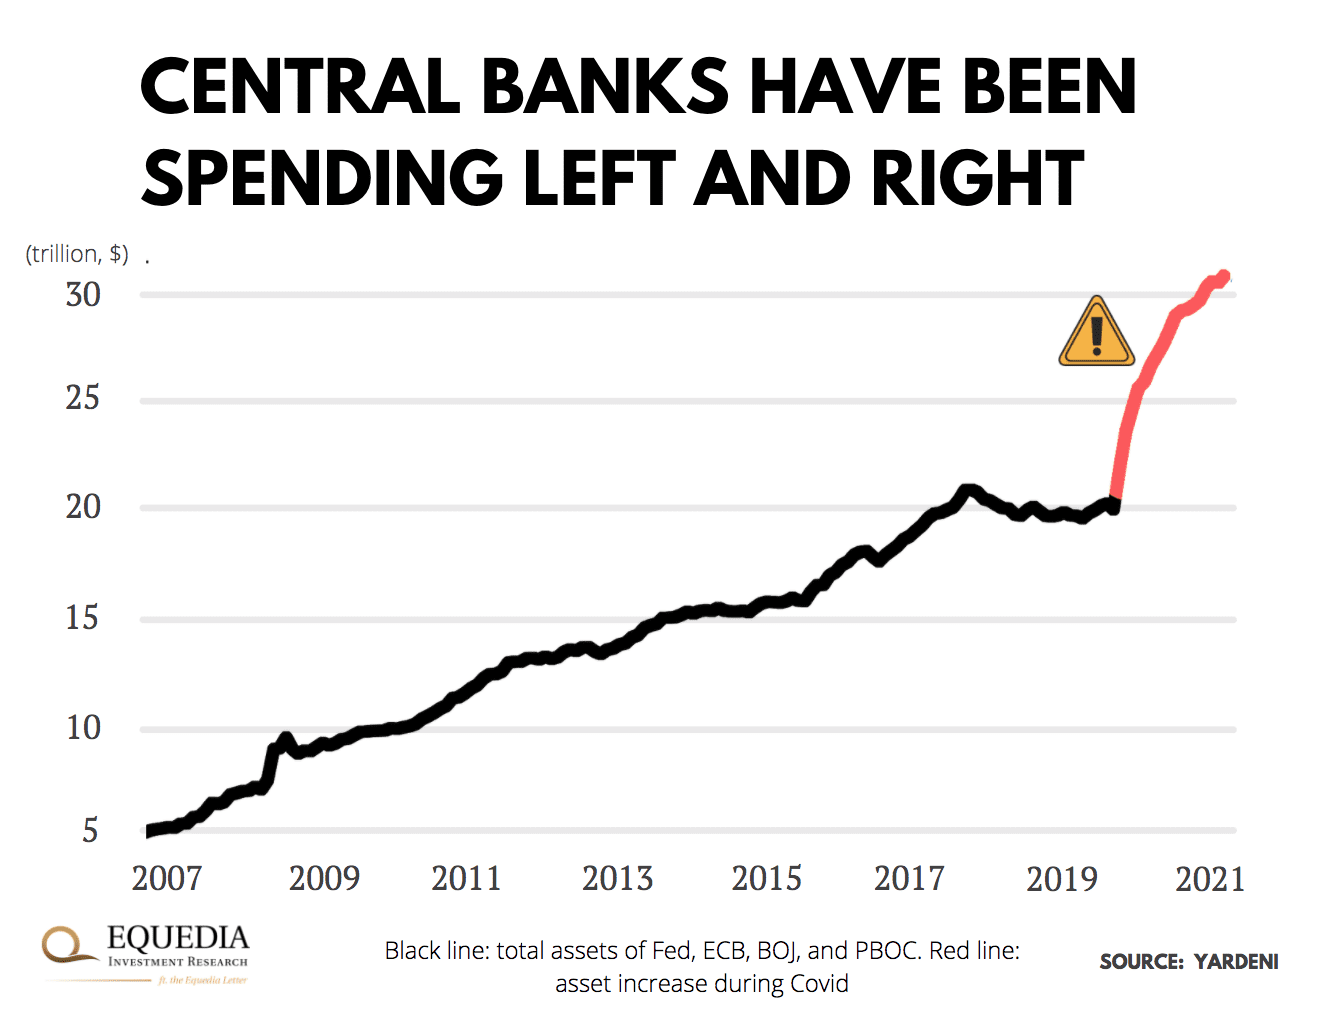
Here’s a chart that shows the exponential growth of central banks assets in the trillions:
Perspective matters here more than anywhere else.
As I wrote in October 2021:
“In less than two years, central banks have stacked up nearly as much money as they did during the past 14 years. Keep in mind that includes shoring up the economy after the housing collapse in 2008.”
On top of that, central banks gave this money away for free.
America and most of the developed world slashed interest rates to zero. Meanwhile, the EU, Japan, Switzerland, Denmark, and Sweden took it up a notch and moved into the negatives.
The Fed’s rates are especially important.
Technically, federal fund rates serve as an interest on overnight loans between banks, which helps control liquidity. But with so much stimulus, the Fed’s rates have grown into a benchmark for everything: credit, stocks, real estate, even crypto.
Just look at how markets react to Powell’s press conferences. A single syllable out of his mouth can move the markets more than a Covid (or any other economic) update.
In other words, the entire economy now hangs on a figure set by a subjective committee. And when that committee lets its hair down, it’s naive to think the economy will stay in equilibrium.
It’s no wonder Ivan emphasizes following the Fed – they truly are the most powerful.
The Domino Chain
The monetary sugar high has set off a domino chain of complications that has thrown the economy off balance.
For starters, as you surely experienced first hand, there’s a massive supply/demand imbalance. Stimulus blew up demand so much that supply can’t keep up with it – even at full capacity.
Contrary to policymakers’ tales, this is not a temporary hiccup because suppliers shut off operations during Covid and can’t pop them back on fast enough. Not quite.
As Ray Dalio’s Bridgewater analysis and data showed, the issue is actually crazy demand.
As I wrote in December 2021:
Here’s a chart showing how US supply has more than recovered. Meanwhile, demand is off the charts:
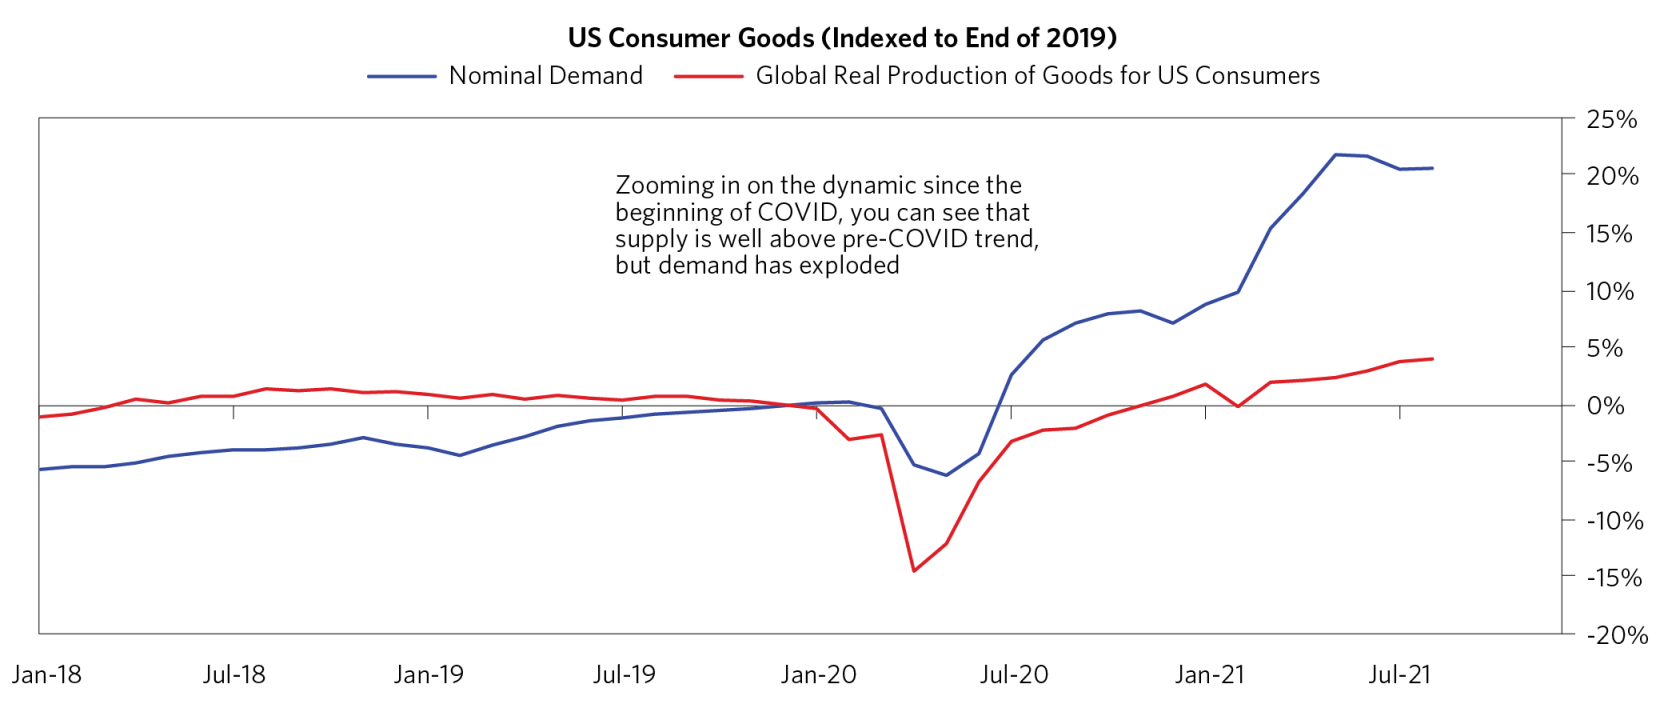
And even though supply is back above pre-pandemic levels, the gap between supply and demand is at its largest since the 1970s:
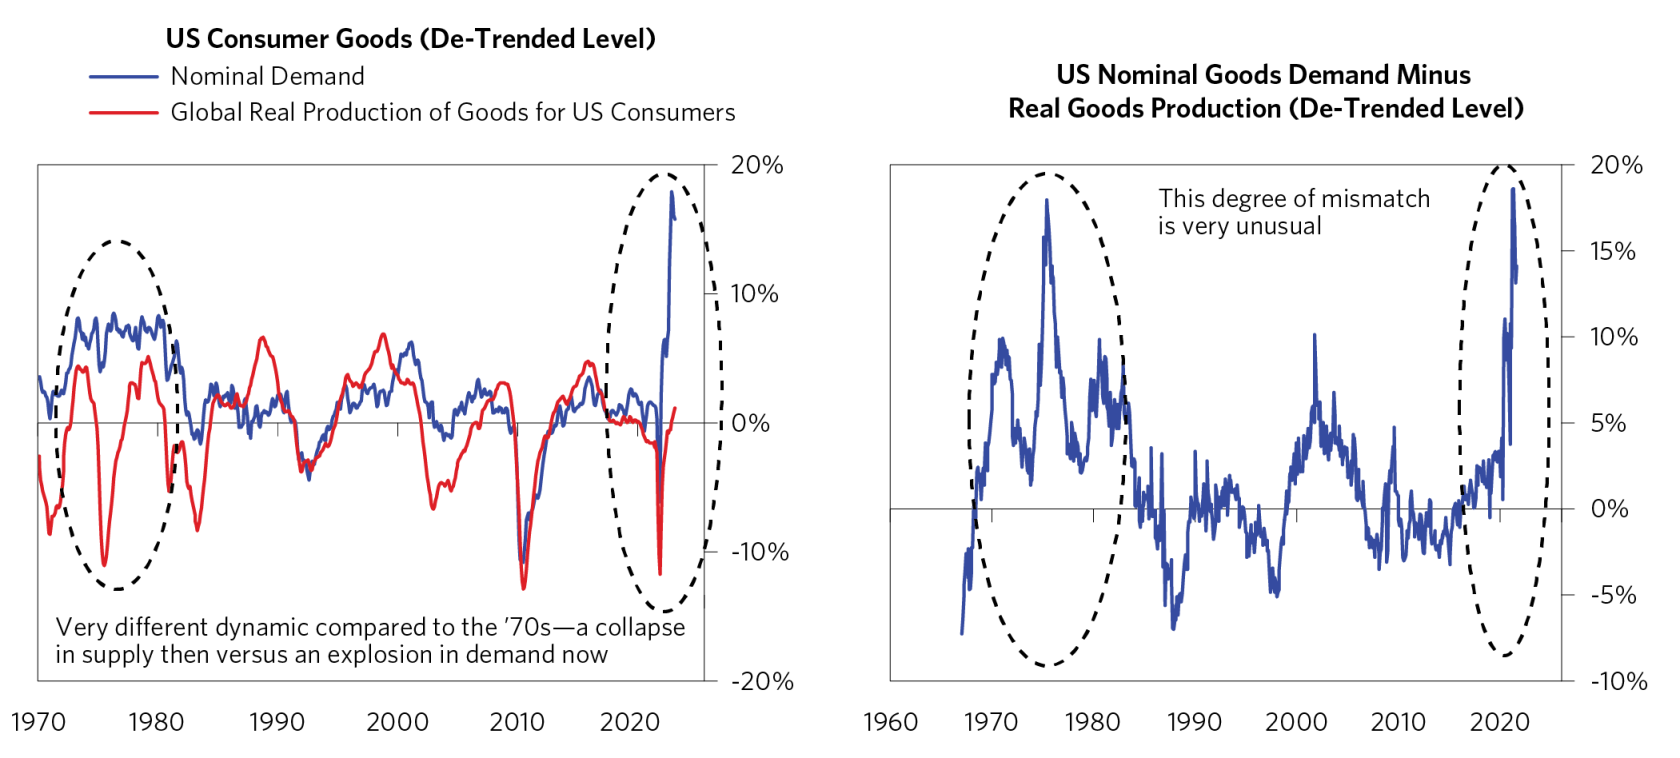
What happens when there’s more demand than supply? You don’t need to be a PhD economist or a Fed governor to answer that. You are going to get inflation.
And boy did we.
By official numbers, most of the world is grappling with the highest inflation since the ’70s outbreak. But when you go beyond the massaged figures, the picture is even more daunting.
Take America’s housing, for example, which is excluded from CPI.
As I recently reported last October, home prices in America’s red-hot markets, Phoenix, Tampa, and Miami, grew 26-32% compared to a year ago. Most of the other markets are also growing at double digits.
It’s clear that fiat is burning up faster than headline figures suggest.
Then there’s debt, which naturally blows up when money is handed out for free.
Last quarter, the world’s debt hit a historic $300 trillion.
Even more shocking is that half of it was accumulated in the past five years alone!
So if you think the Great Reset plan is a conspiracy, then you’ve already lost.
And it’s not just governments that are up to their ears in debt.
Corporations also leveraged zero rates and grew their debt to the highest levels on record. Even this year, they continue to borrow at record pace.
Via FT:
“Companies raised more than $100bn on the bond market in the first week of this year as finance chiefs kicked off an effort to lock in low borrowing costs before benchmark interest rates start to climb. Global corporate bond issuance reached $101bn in the year to January 7, with US deals reaching a record pace. The global haul trailed only a blockbuster $118bn start to 2021, which was the highest on Refinitiv records going back 19 years.”
Meanwhile, stimulus set off a historic speculation frenzy in risk assets. Stock valuations approached dot-com levels. America’s housing affordability (key real estate yardstick) topped 2008. Crypto…well, you’ve seen the news.
The problem is, now the debt-soaked economy hinging on stimulus and speculation is so sensitive to interest rates it can’t withstand the very remedy that could fix inflation and other imbalances.
And that invalidates a LOT of what you’ve been told about investing.
RIP 60/40
Remember the good ol’ days when investing was much more straightforward? And when you didn’t have to risk breaking your neck just to beat inflation?
All you had to do was take 60% of your money and put it in stocks. Then set aside the other 40% for safer bonds. This 60/40 allocation was the gold standard for decades. And it worked like charm.
Over the long term, this portfolio strategy generated an annualized return of 10% since the early 1980s. And in the last decade, it earned a strong 11.1% return—thanks to the record-long stock rally.
In other words, this simple strategy was enough to retire on with an average 401k.
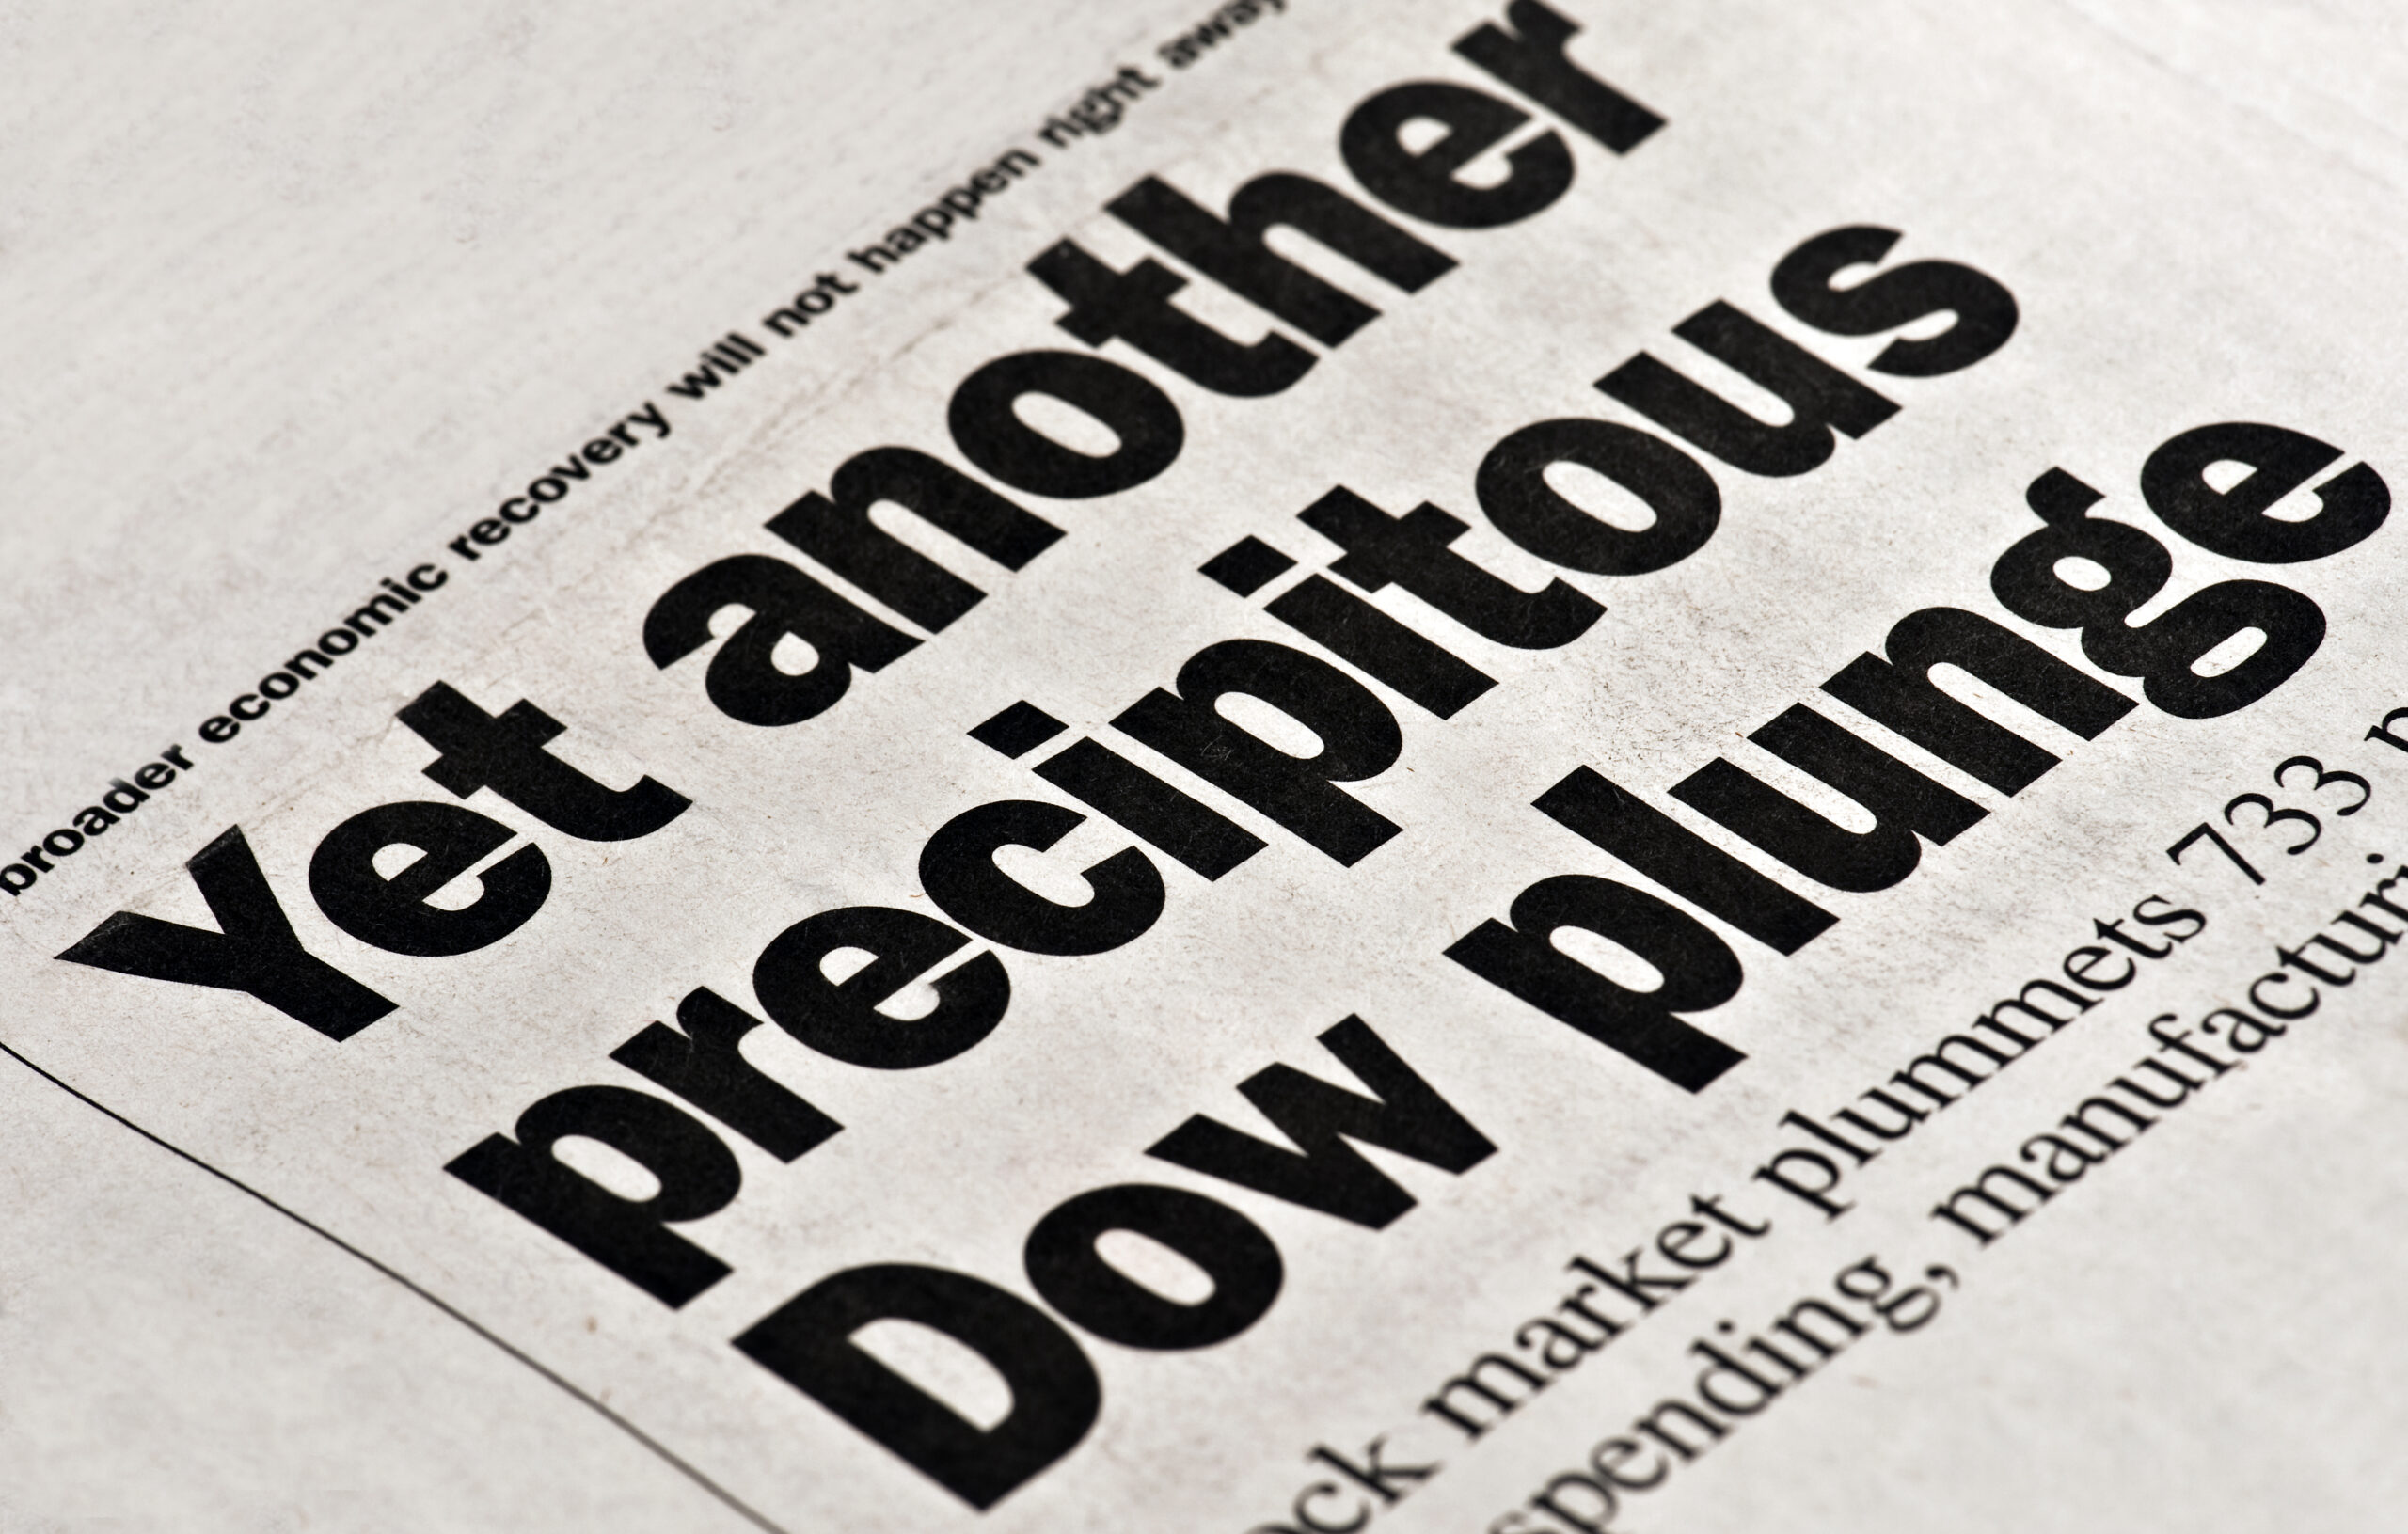
Unfortunately, the heyday of 60/40 is over. You’ve probably seen headlines like this lately:
The reason is that stocks and bonds become so expensive that it caps the portfolio upside. And as this January showed, the bond allocation is not only losing money (in real terms), it no longer insulates a portfolio from a dip in stocks.
Last month, the 60/40 portfolio saw its worst monthly drop since the beginning of Covid. It lost about 4.2% of its value. For perspective, that’s nearly as much as the all-stock S&P 500 lost in January.
Compare this to the Covid crash in March 2020 when the S&P 500 lost 32%, while the 60/40 portfolio only shrank by 7.7%.
What happened?
60/40 killers
It all comes down to two things.
For the past 40 years, the 60/40 portfolio has been riding on two macro tailwinds:
- Falling rates
- Low inflation.
Take a look:
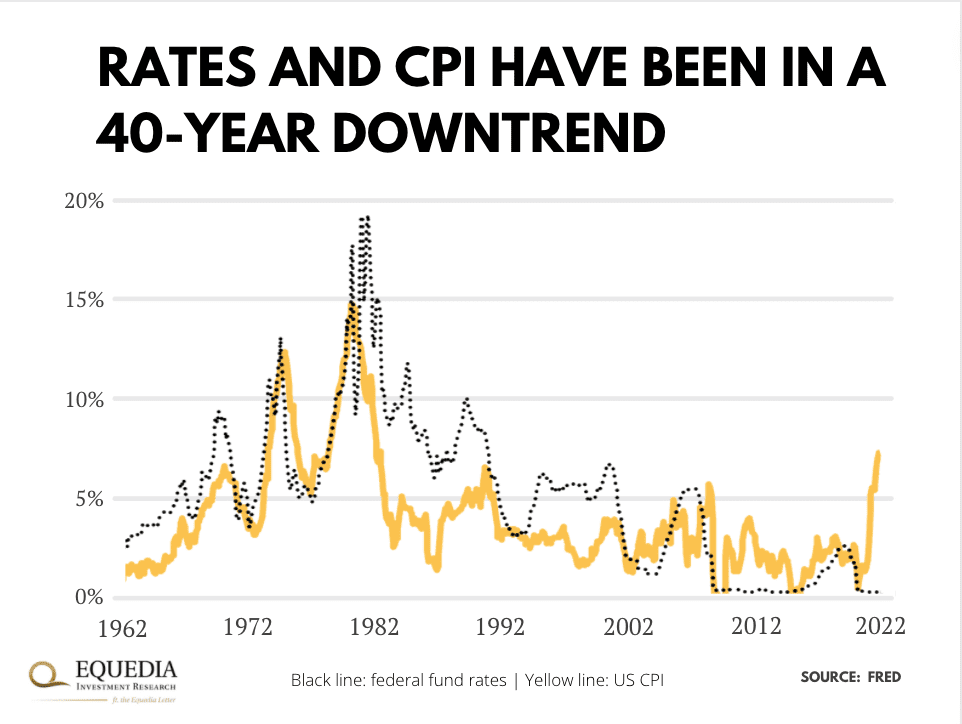 This setup created a perfect environment for bonds and stocks.
See, stocks thrive on lower rates because cheap money brings down their cost of capital (WACC). Then the lower WACC shrinks the discount rate on future earnings, which, in turn, jacks up stock valuations.
(And vice versa, of course. This is why you see so much volatility in the stock market ahead of the Fed’s hikes.)
Here’s what it looks like:
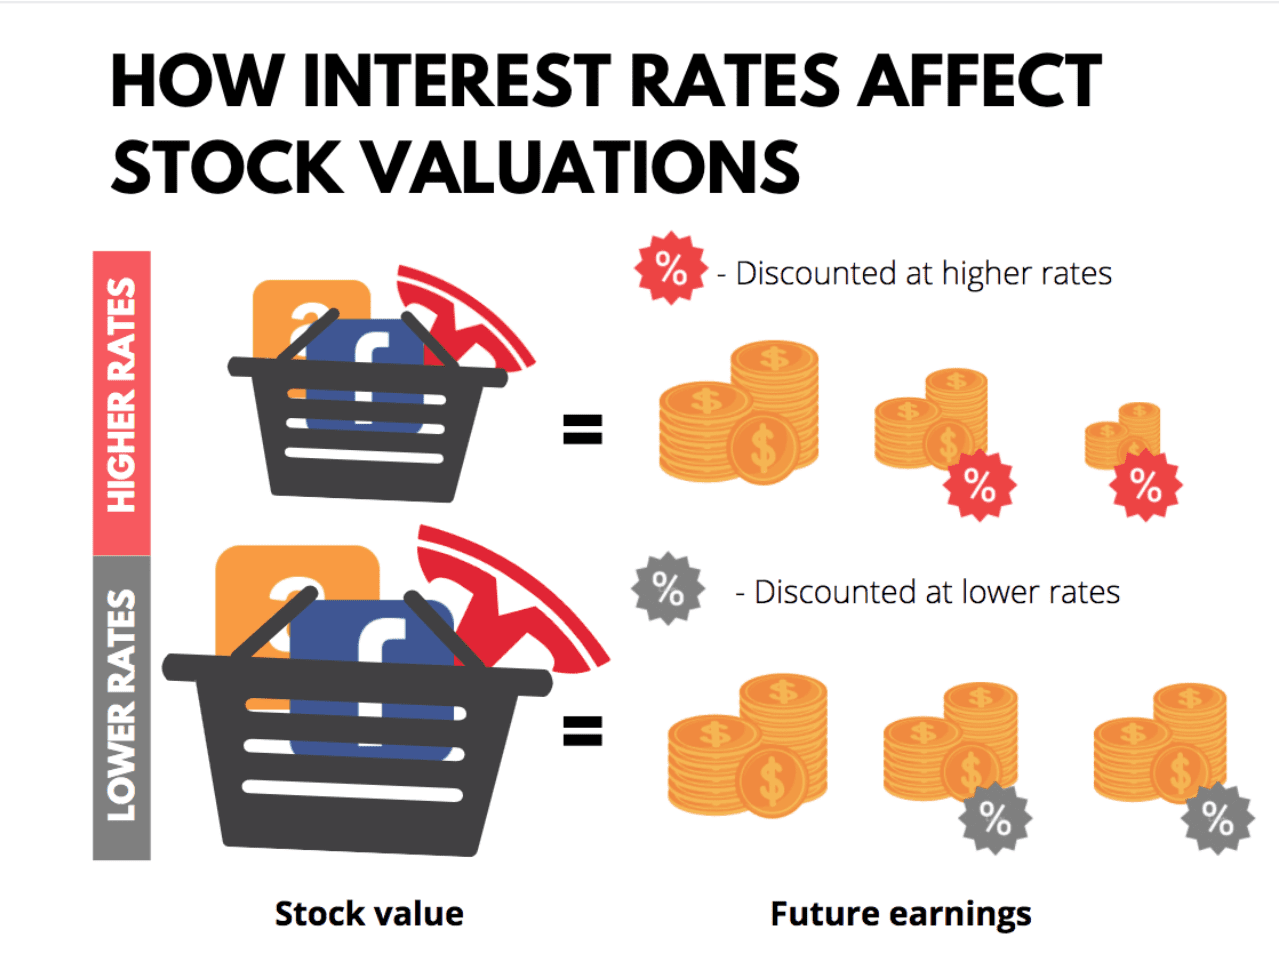
Meanwhile, at higher rates, bonds yield more. And when inflation is in check, the safest Treasuries can beat CPI and earn a little on top. That’s a far cry from today when even speculative junk bonds earn a negative real yield.
More importantly, bond portfolios typically rise in value when rates fall. That’s because the lower yield on newly-issued bonds makes your higher-yielding bonds more valuable in the market.
So, in a period of higher rates that are falling, not only do bonds yield more, their market value grows, too.
The thing is, we probably won’t see this setup for years.
Interest rates are already at zero, so they can’t go much lower. In fact, most central banks are gearing up to dole out three, four, and even as high as seven hikes this year. And with inflation nearing double digits, could we be in for a decade of rising rates?
That’s a big headwind for stocks, and most importantly, bonds—the two 60/40 components that are supposed to balance each other out.
So, how are we going to invest in this new regime?
We’ll talk about that next week. Stay tuned…
– Carlise Kane