One Number Turned a Forgotten Stock Into a $2.4 Billion Giant. A Smaller Company Just Posted a Bigger One. A tiny company just claimed America's largest antimony resource, and the last byEquediaJuly 15, 2026
The Hole That Refused to Quit 250 metres underground — past where these gold systems are supposed to die — a byEquediaJune 23, 2026
A Trillion-Dollar Trade Hiding in Plain Sight While the basic investors argue about chatbots, chips, and trillion-dollar byEquediaJune 7, 2026
By the Time You Read This, They’ve Already Bought More The most powerful institutions are buying it at a pace we haven't seen in over byEquediaApril 27, 2026
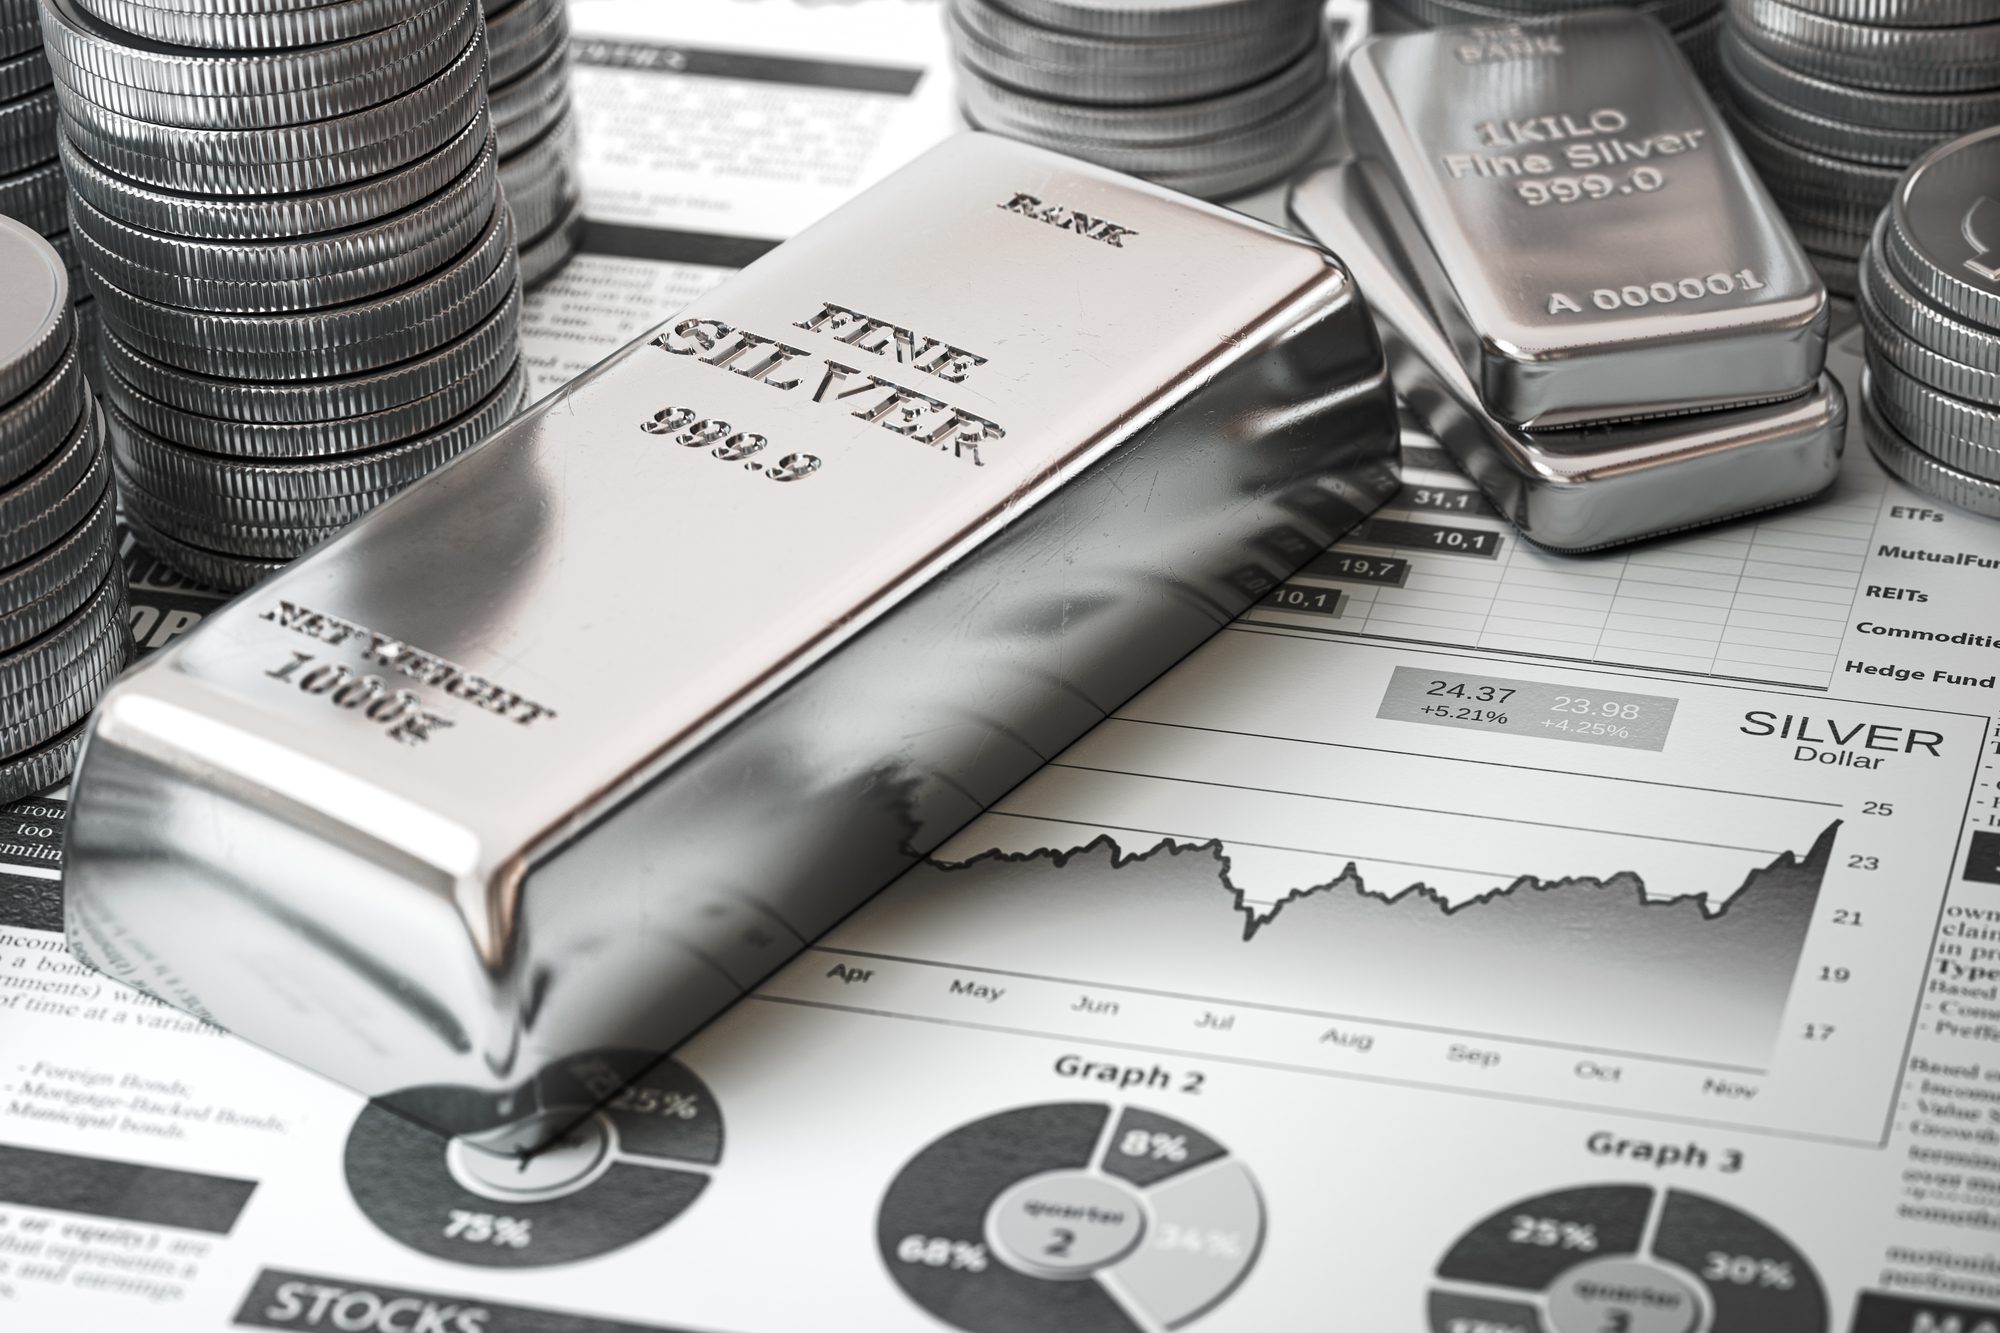
Commodities and Resource Equedia Letter Exclusive Content Investment Ideas Metals and Mining SilverDecember 14, 2025 The Monster is Back This silver company could be onto something massive, and the scale of it is
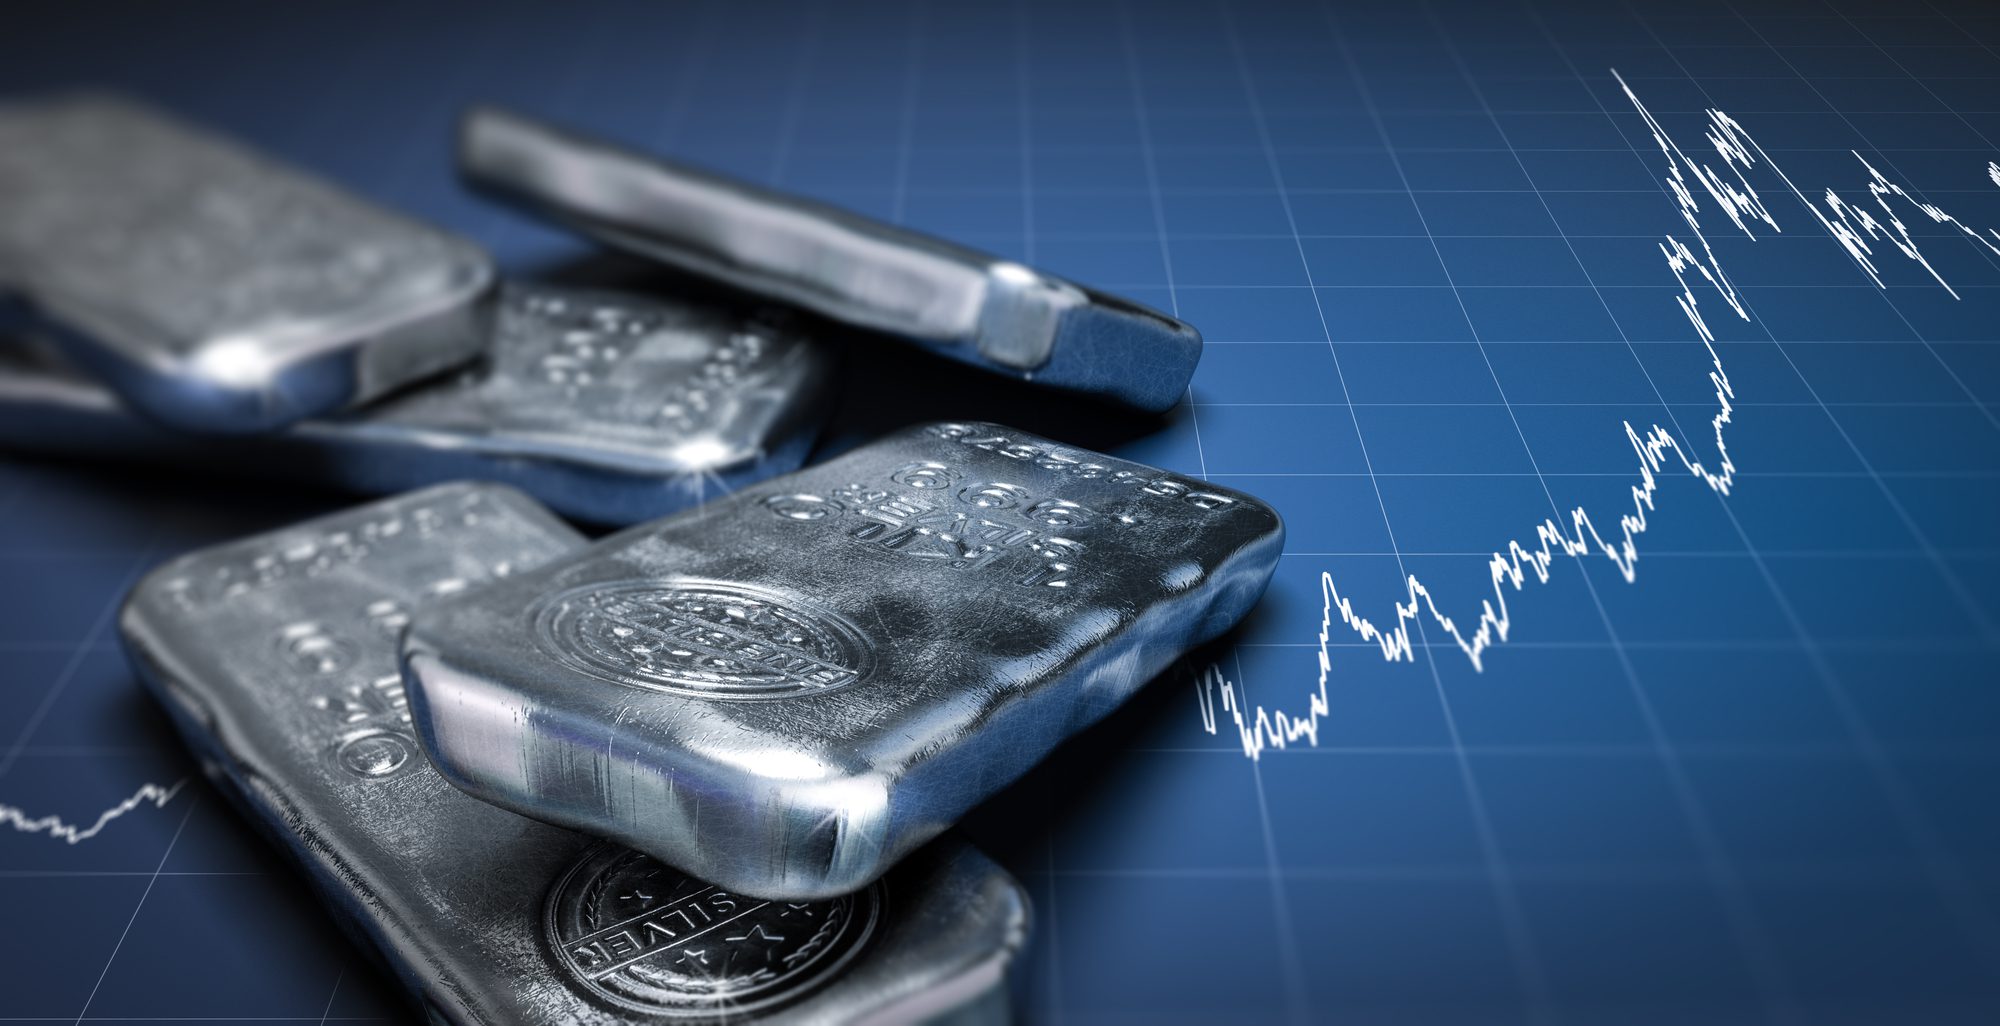
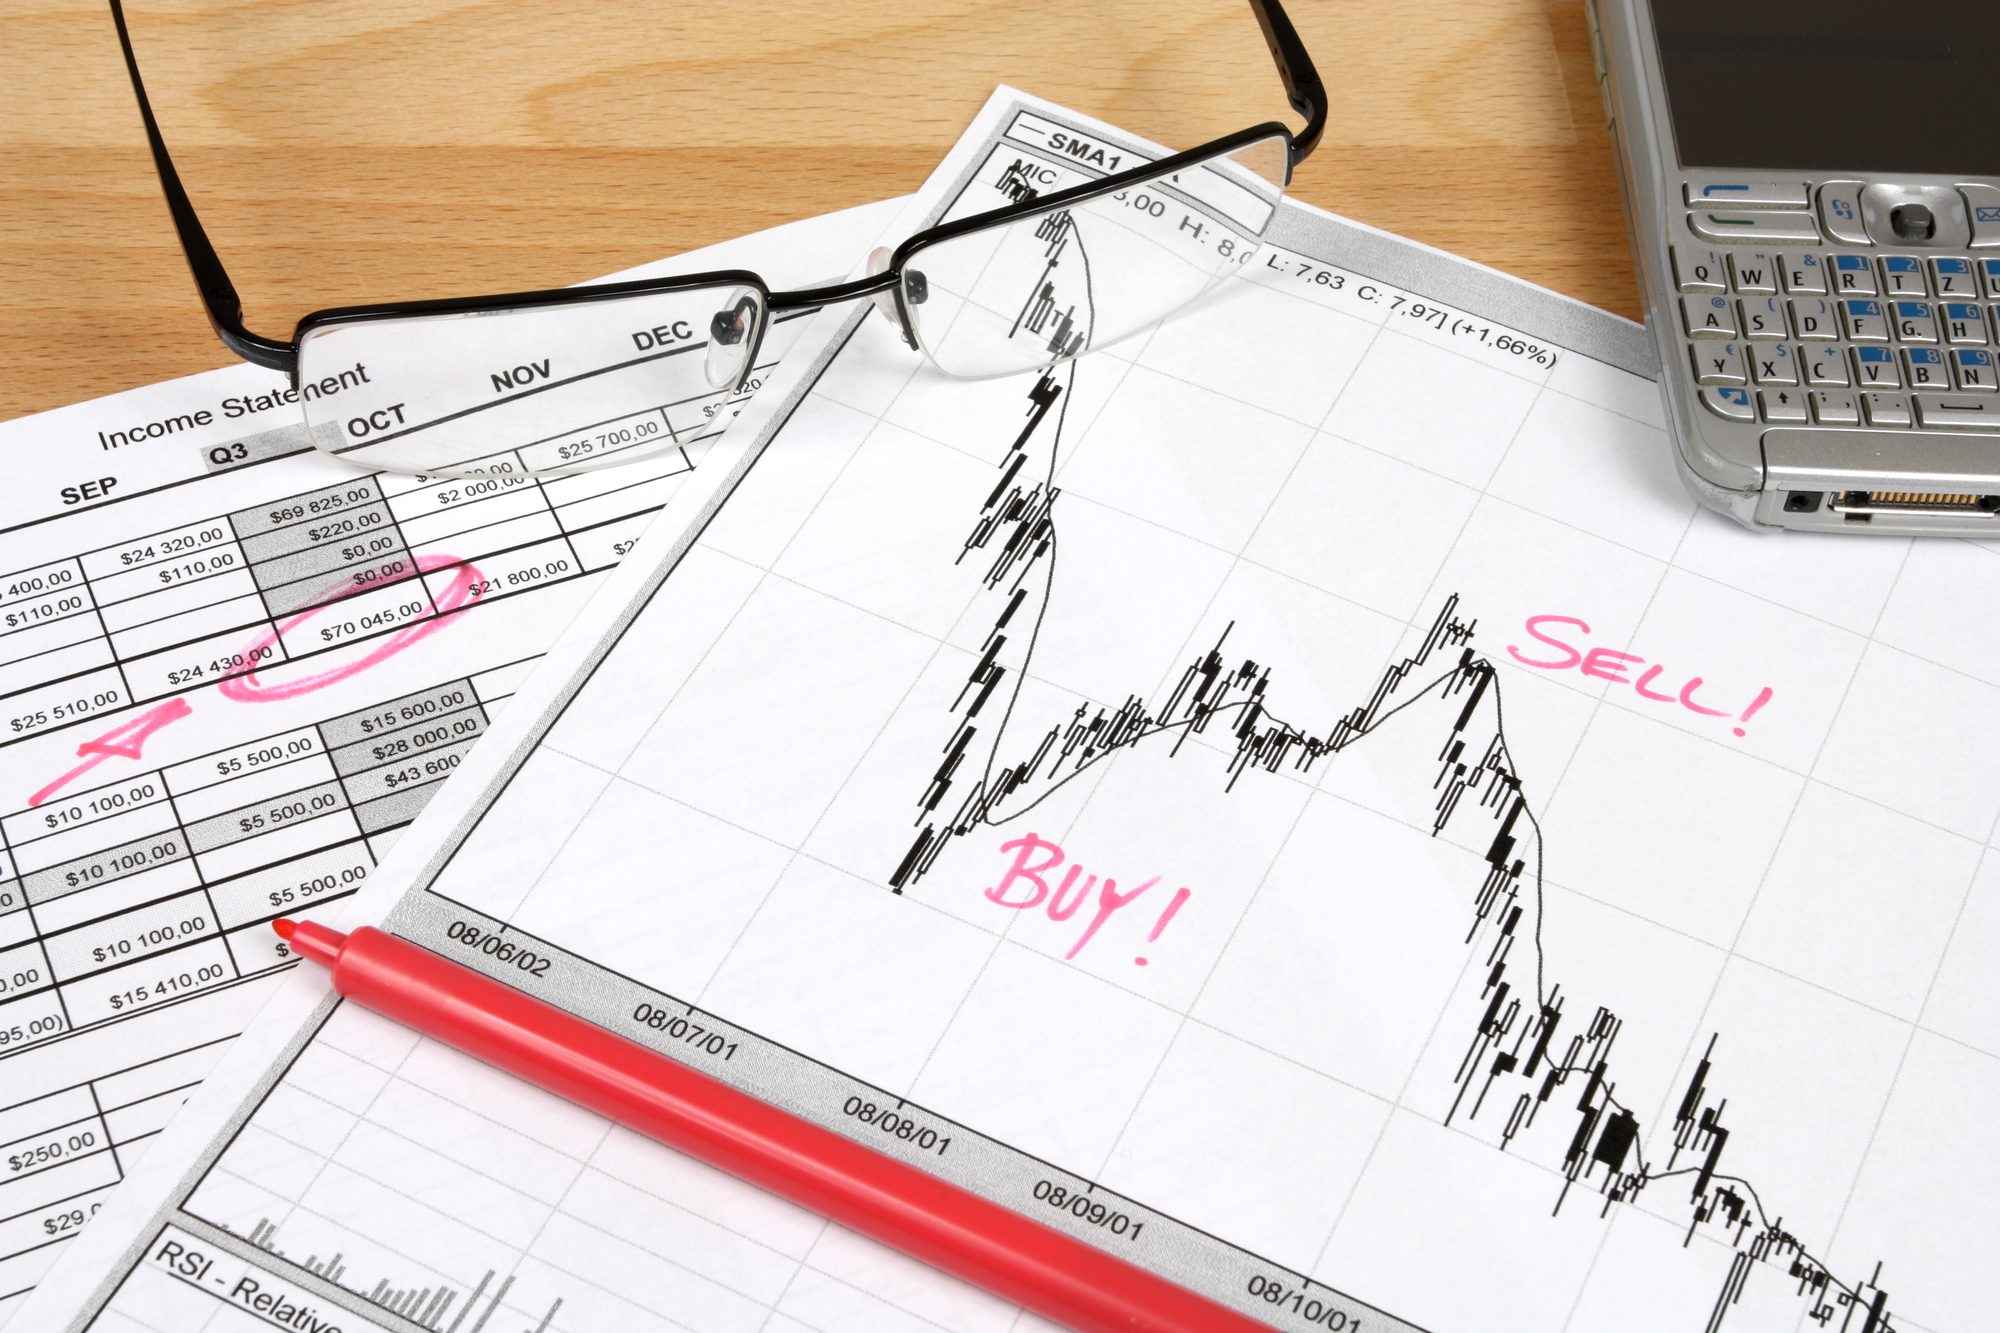
Instructional Metals and Mining Silver Stock Charts Technical AnalysisJune 14, 2022 Silver Price Analysis: Hanging On by a Fibonacci Thread The weekly chart for silver is accumulating a series of negative technical
Instructional Metals and Mining Silver Stock Charts UncategorizedFebruary 12, 2022 Silver Chart Analysis for February 2022 Silver has shown great resilience at the $22 level
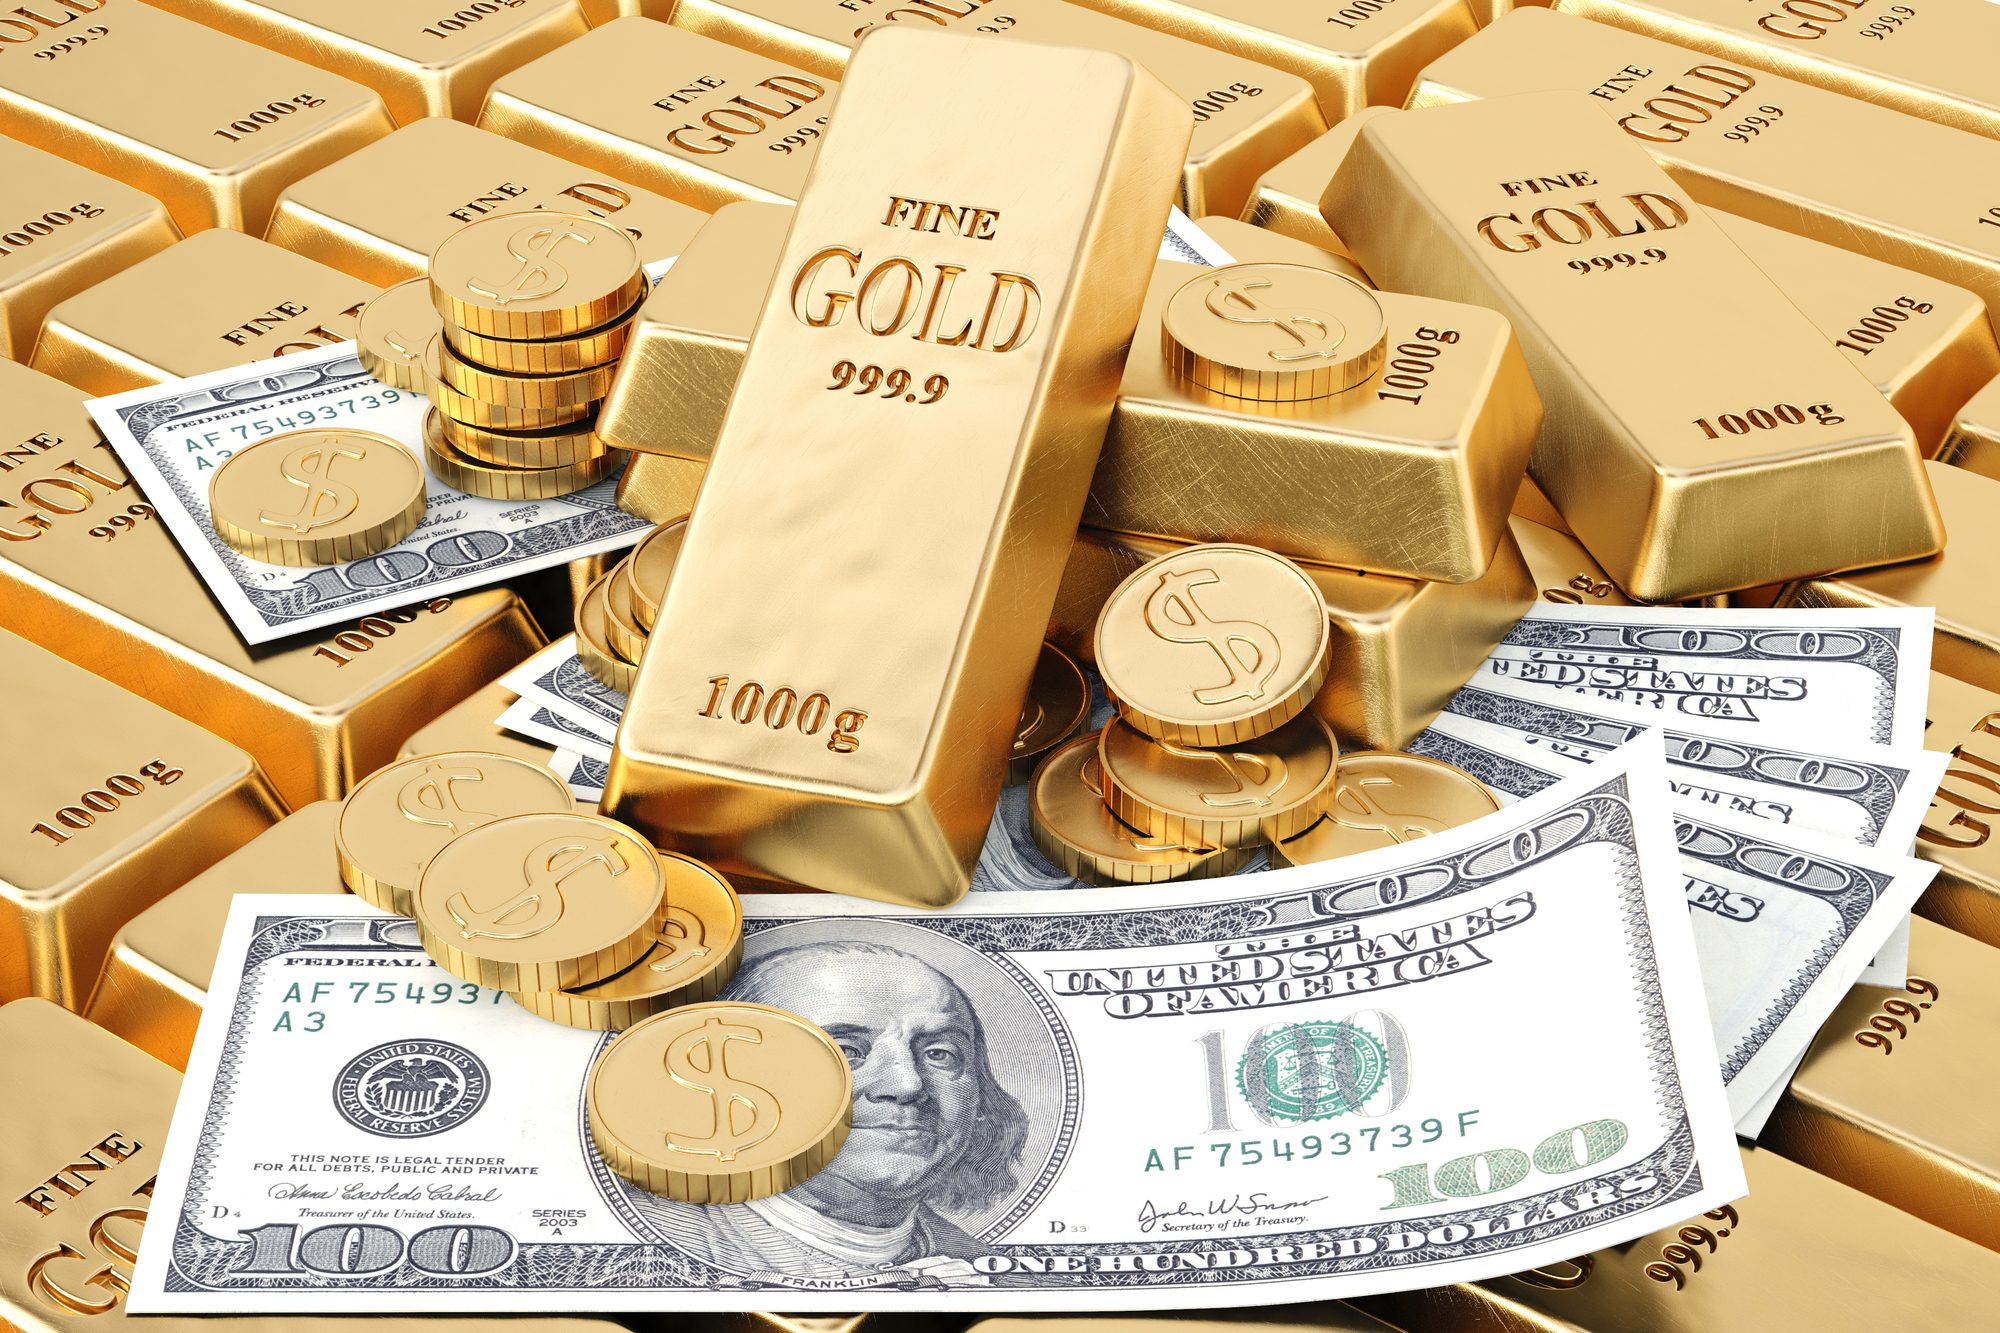
UncategorizedNovember 23, 2021 General Chart Analysis of Gold, Silver and the Dollar An analysis of gold, silver, and the US Dollar, using technical charts to look
Instructional Metals and Mining Silver Stock Charts Technical AnalysisAugust 31, 2021 Silver Chart Analysis: A Review of Silver Using Different Time Frames We look at silver through the lens of time, using monthly, weekly, and daily
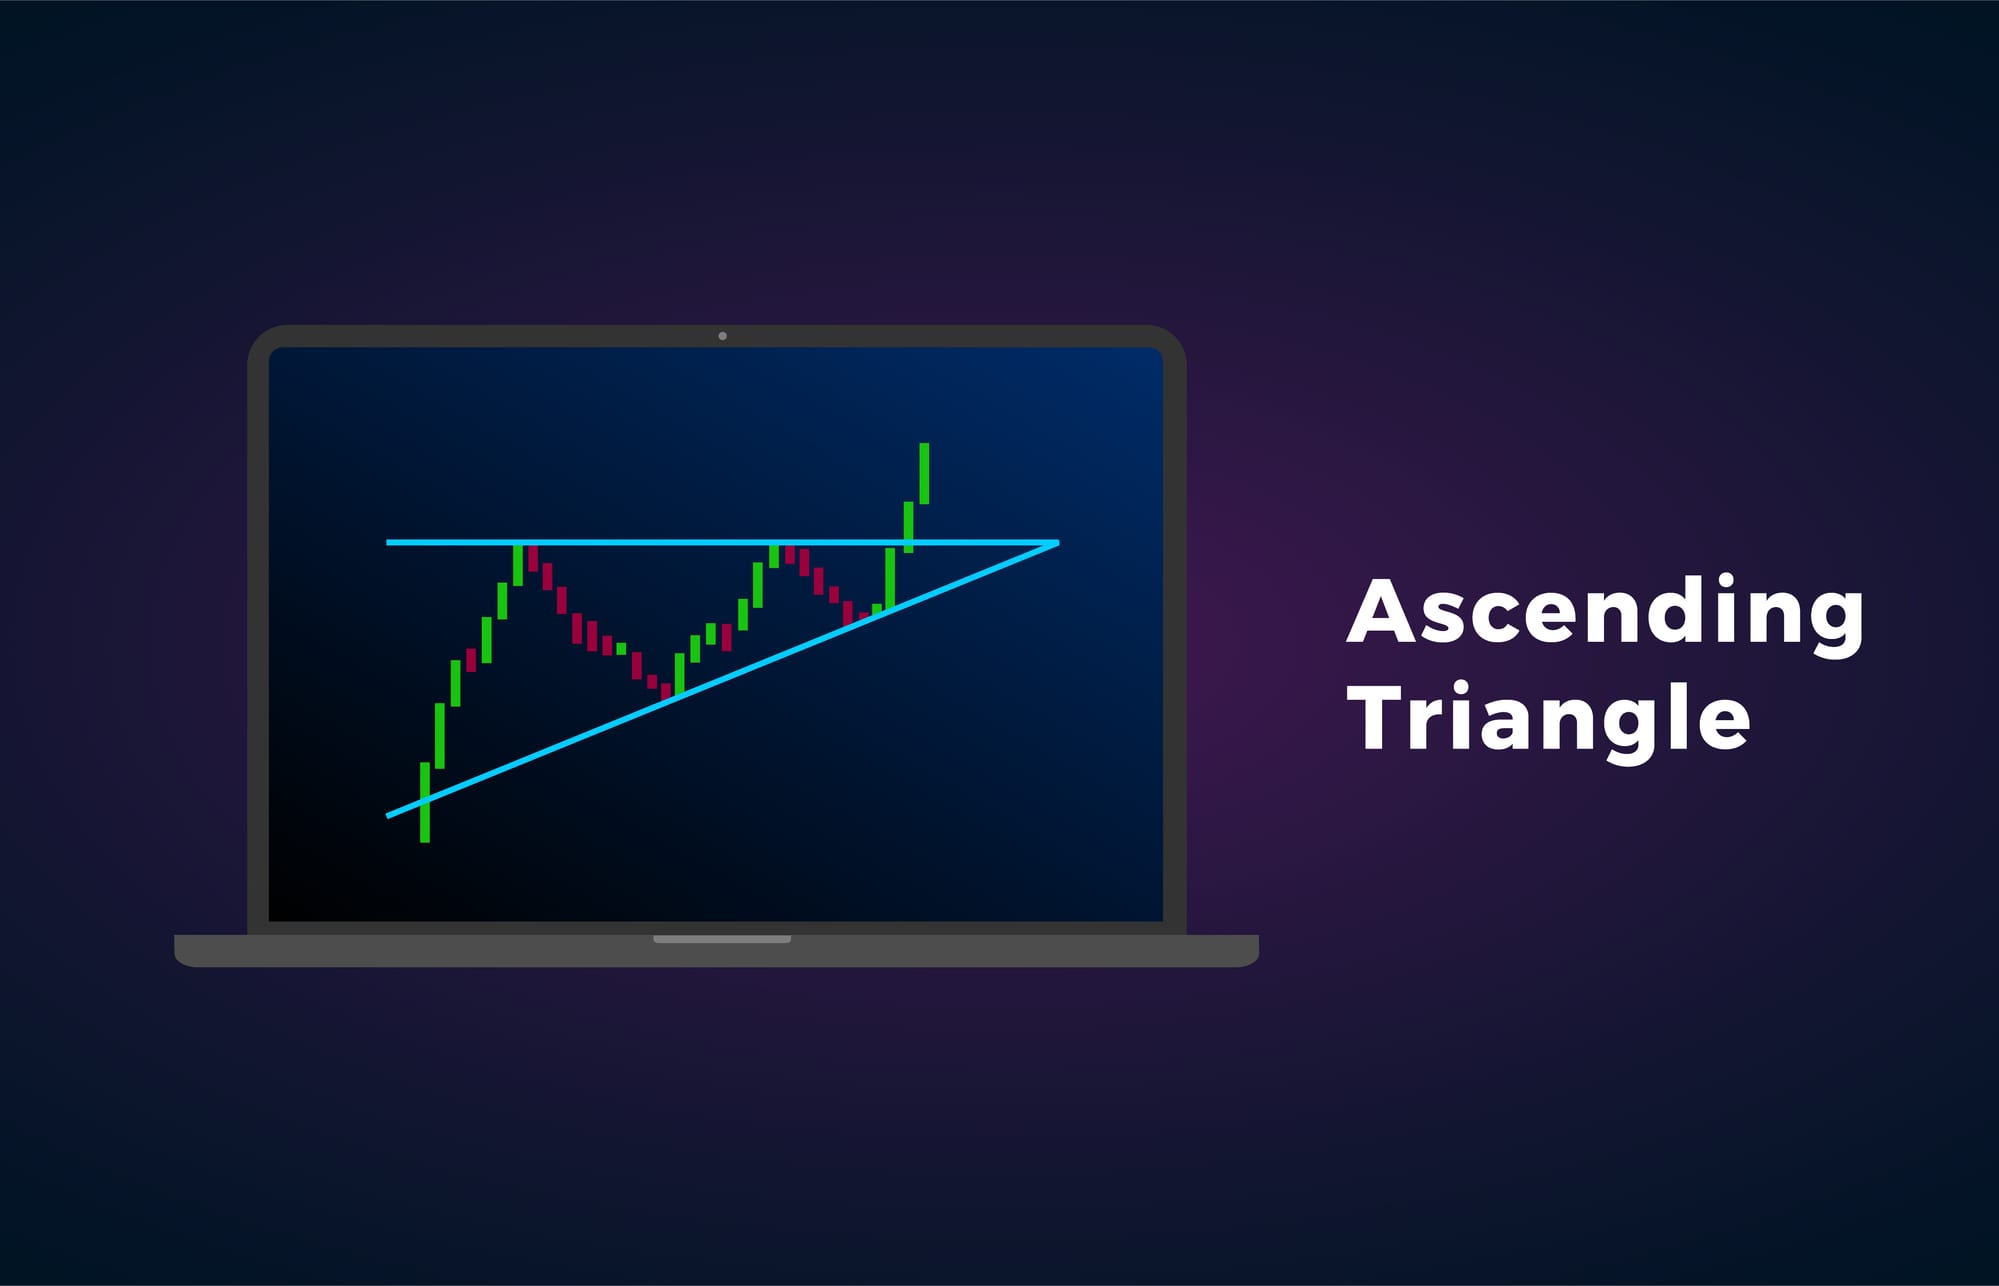
Instructional Silver Stock Charts Technical AnalysisJune 3, 2021 Positive Technical Pattern for Silver – Awaiting Confirmation of Break-out A few months ago, we looked at the weekly chart for silver
Gold Instructional Metals and Mining Silver Stock Charts Technical AnalysisApril 9, 2021 Silver Weekly Chart Lagging Gold Chart – But Will a Decline be Avoided? Gold and silver go hand-in-hand when referring to precious metals
Investment Ideas Metals and Mining SilverOctober 13, 2020 An Early Examination of Reyna Silver: RSLV Geology is a profession that requires imagination but also discipline
Market Outlook Metals and Mining SilverNovember 22, 2019 Silver: Gold’s Poor Cousin or a Cheap Impostor? Much has been made of how “silver follows gold” or “silver is a poor man’s gold”
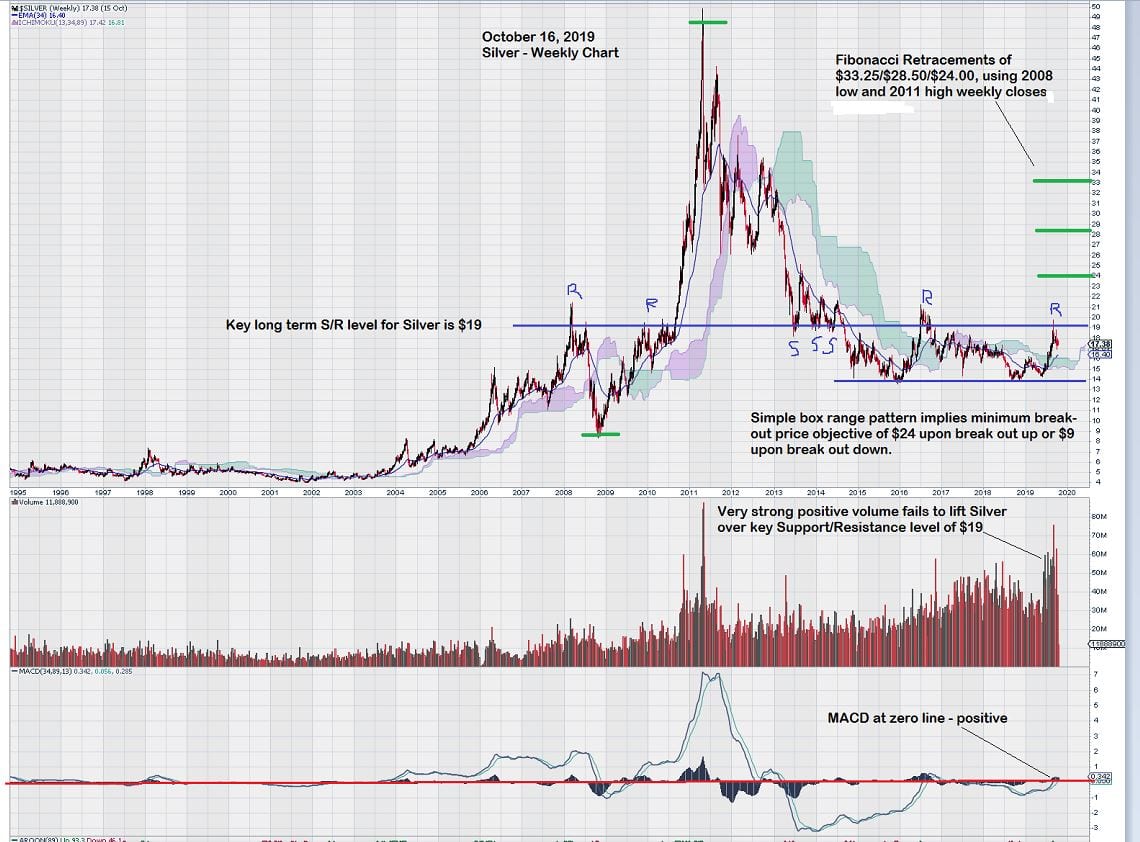
Exclusive Content Stock ChartsOctober 16, 2019 Silver Chart Analysis for October 16, 2019 A local broker contacted me to take a look at silver and here is a weekly chart
Equedia Letter Exclusive Content Gold Metals and Mining Silver Untold TruthsSeptember 22, 2019 Conspiracy Revealed: The Real Reason Why Gold is Going Higher Think you know why gold prices are climbing?
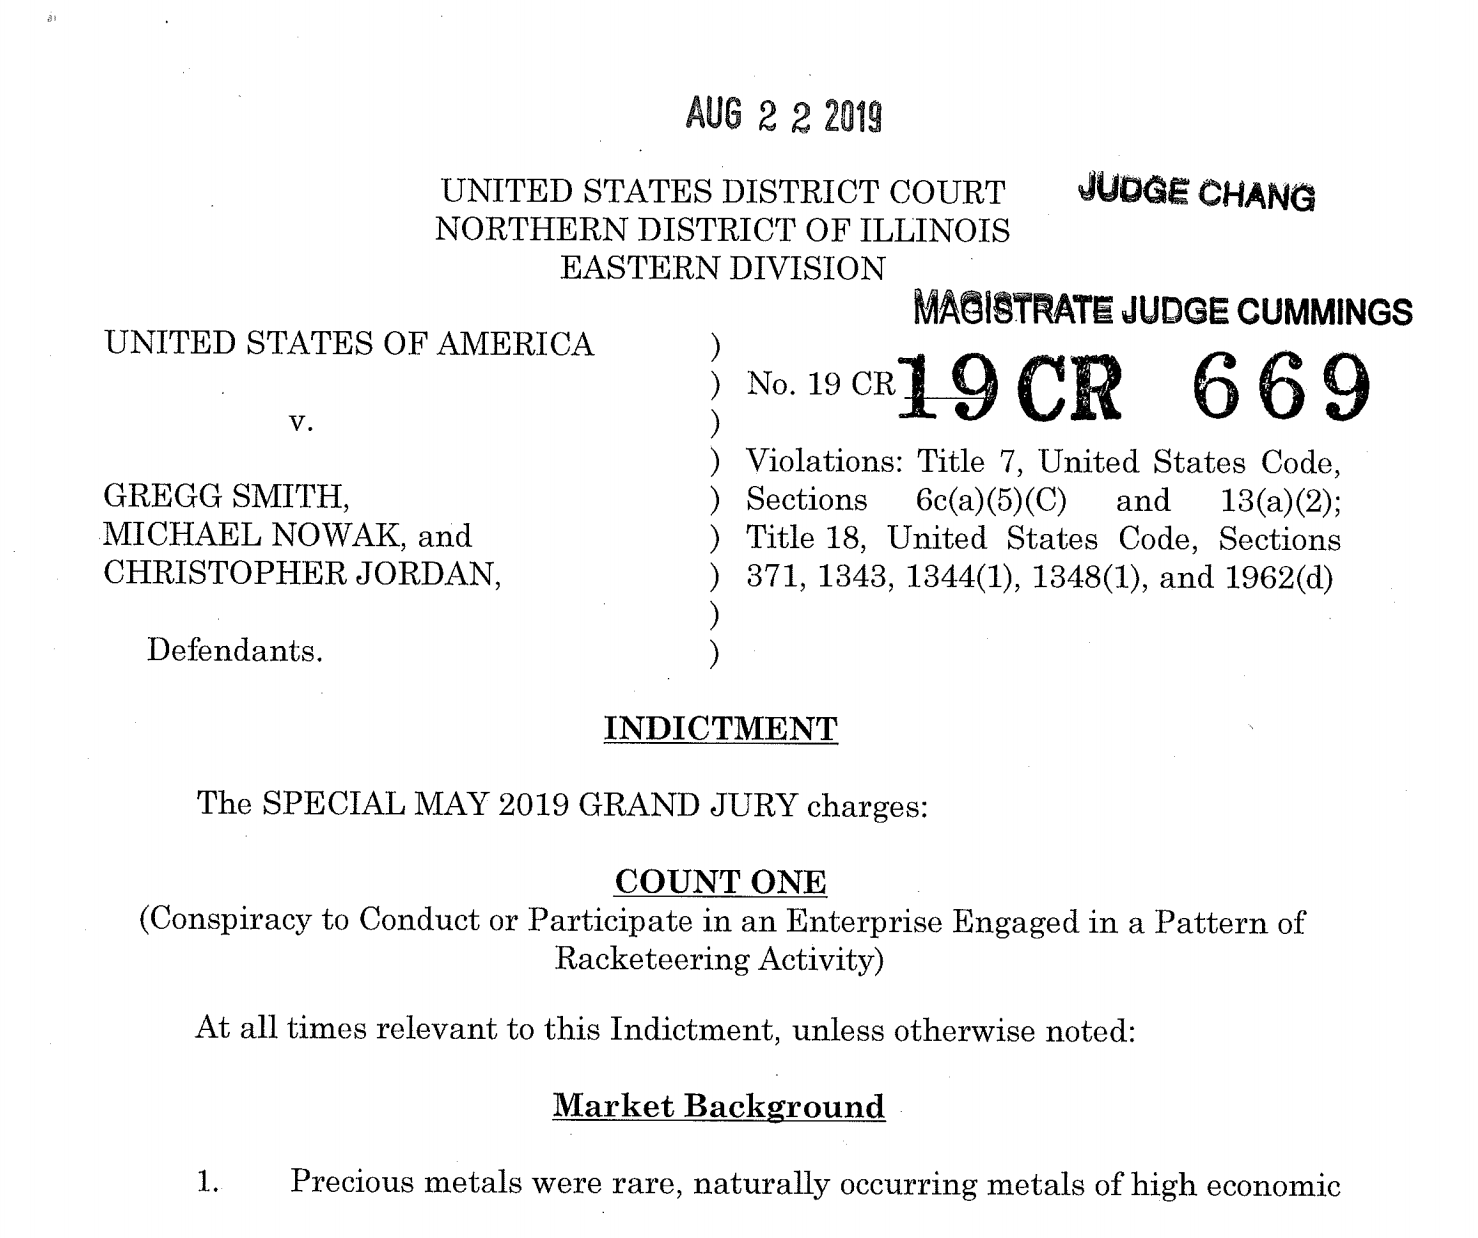
Gold Metals and Mining Silver Untold TruthsSeptember 22, 2019 Full Indictment of JP Morgan Traders on Conspiracy to Commit Price Manipulation, Bank Fraud, Wire Fraud Affecting a Financial Institution, Commodities Fraud, and Spoofing Full Indictment of JP Morgan Traders on Conspiracy to Commit Price Manipulation,