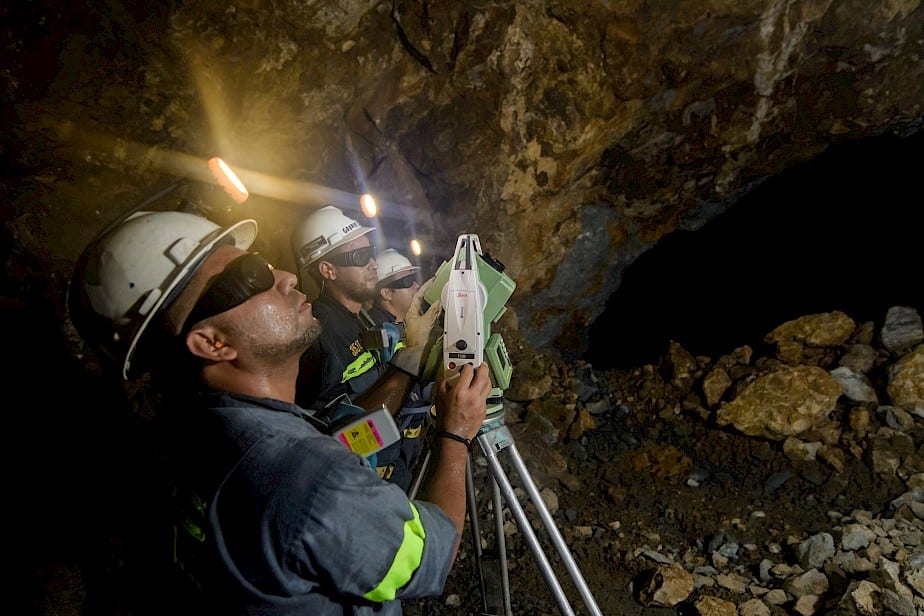
Last week I attended an investment conference that featured about two dozen small exploration companies. Primarily, the Canadian exploration focus was in two areas, the established gold camps in the greenstone belts of Quebec/Ontario and the emerging Golden Triangle region of British Columbia. The international explorers covered Nevada/Mexico and parts of South America. Single company focus was in other regions such as southwestern USA, the far north of Canada and the Yukon.
The conference was hosted by a small group of newsletter writers. Each one had their own opinion of where they saw both the gold price and how this might impact their “picks”. The consensus opinion for the price of gold over the next year ranged from $1400 – $1700. A technical analyst forecasted a price of $1700 by way of a “measured move”. The others did not provide a basis for their estimates.
My expectations are shared for the downside price target as I see $1365 as a strong support level so $1400 is completely reasonable. However, with strong over-head resistance defined by the gold chart at $1575, it would likely take an unusual event in either of the stock/currency/credit markets to give gold the necessary fuel to trade above this level. Geopolitical events, so far have not impacted gold the same way as they did in the 1970’s and 1980’s, but there is a possibility for chaos to reign supreme in many different places. A kind of global “contagion of uncertainty” could easily prevail. Perhaps it has already started…..
This brings me to my headline topic: silver.
Much has been made of how “silver follows gold” or “silver is a poor man’s gold” and other such well used sayings.
However, this is simply not the case. Let’s take a look at the silver chart and compare it to the gold chart to see how gold has and is performing well, while silver is not. First we will look at gold.
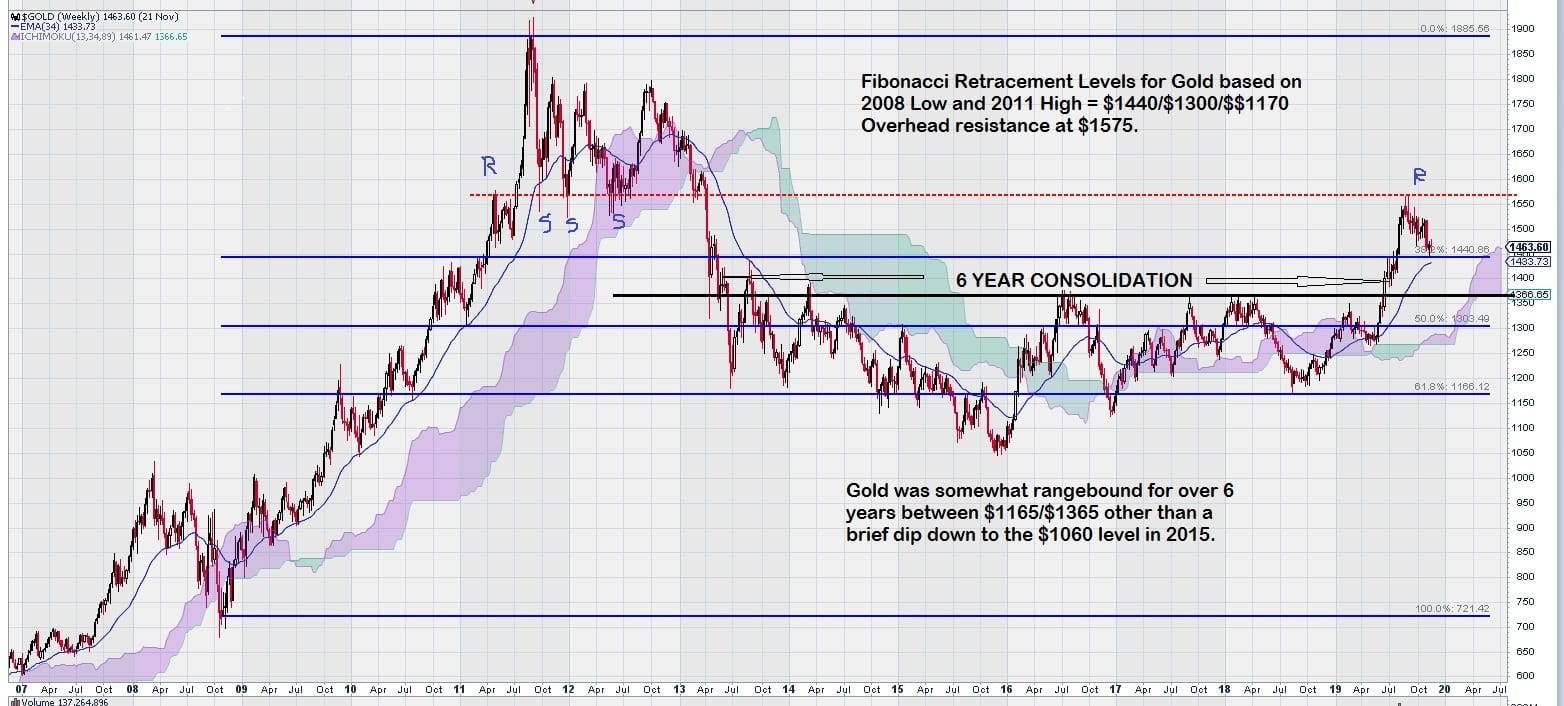
It is very clear that that gold has broken out and up from its well defined consolidation range of $1165 – $1365. This 6 year consolidation has provided a solid base of support at the $1365 level.
The next important level for gold to overcome is around $1575. It is reasonable to expect some further “sideways trading” for gold between $1365 and $1575.
As an aside, gold stocks, as measured by the S & P TSX Global Gold Index have not matched gold’s break-out performance when measured against the same time period, ie. using the 2008 low and 2011 high for gold stocks to establish Fibonacci resistance levels.
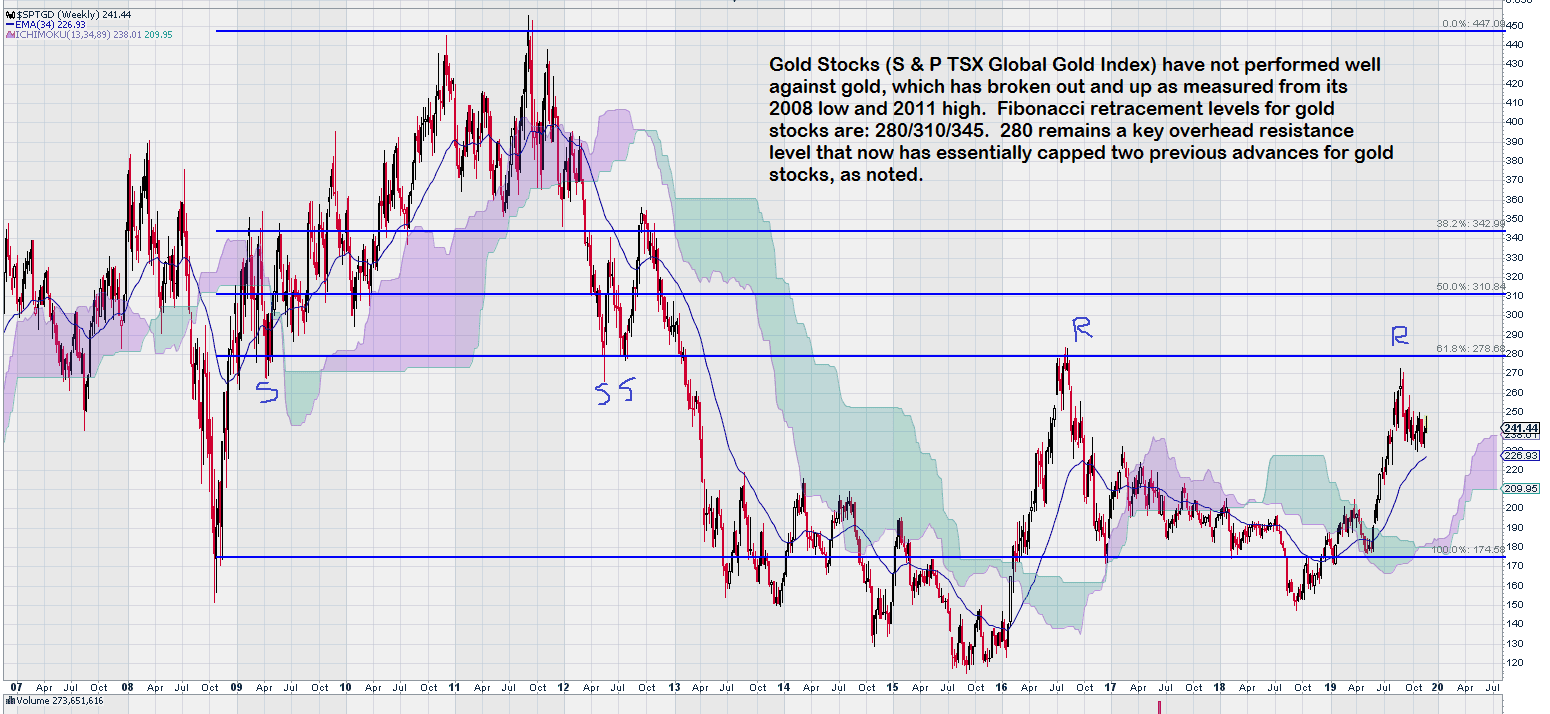
Gold stocks have yet to surpass the important over-head resistance level of 280. This is a very key level. As shown, it provided good support (as expected) when it was the last Fibonacci support level from the lows in 2008 to the highs in 2011. Later, in 2016, again as expected, this important support level became an equally important resistance level. Indeed, it did put the brakes on the rally in gold stocks that took place in 2016, and again, more recently in August of 2019.
The last 3 – 4 months have been a good test for gold stocks. After a re-test of the 280 level (actually slightly below) gold stocks are showing signs of accumulation in a narrow range of 235 – 250.
And now silver…..
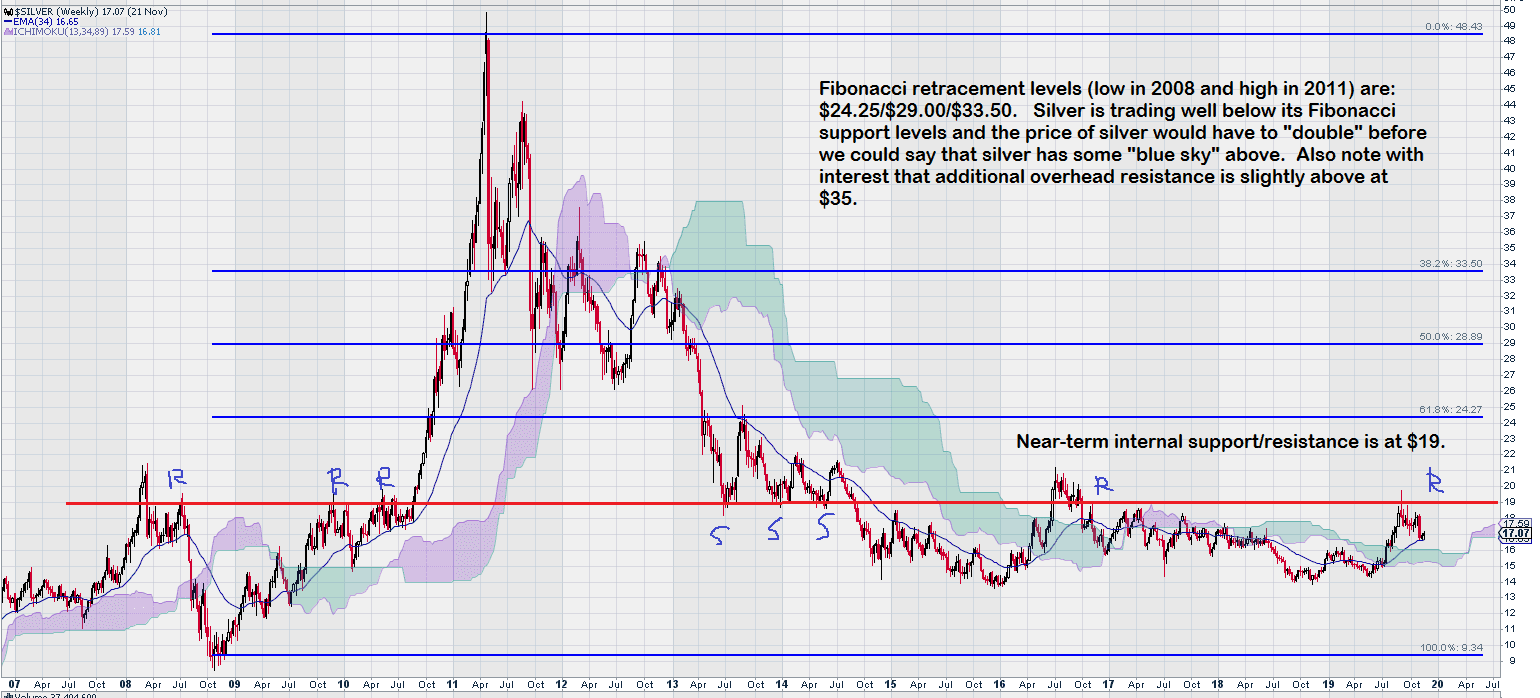
In the very near term, silver needs to trade above the key chart level of $19. Like gold, silver has been in a 5 year consolidation between $14 and $19. A minimum price object upon break out up would be $24. Unlike gold, silver has yet to break above the upper range of its “box range”. Also it should be evident that for gold, the same upper range of its “box range” was at $1350/$1375, well above the middle Fibonacci retracement level of $1300.
There is an triple exponentially smoothed moving average known as TRIX that is showing some interesting insights into all three of these charts – but that is a story for another day.