
In February, we reviewed the weekly chart for silver, and made this comment in our silver price analysis:
“Silver remains in “no man’s land.” It appears to be consolidating within a defined range of $22 – $28.”
Let’s see what the weekly silver chart looks like today:
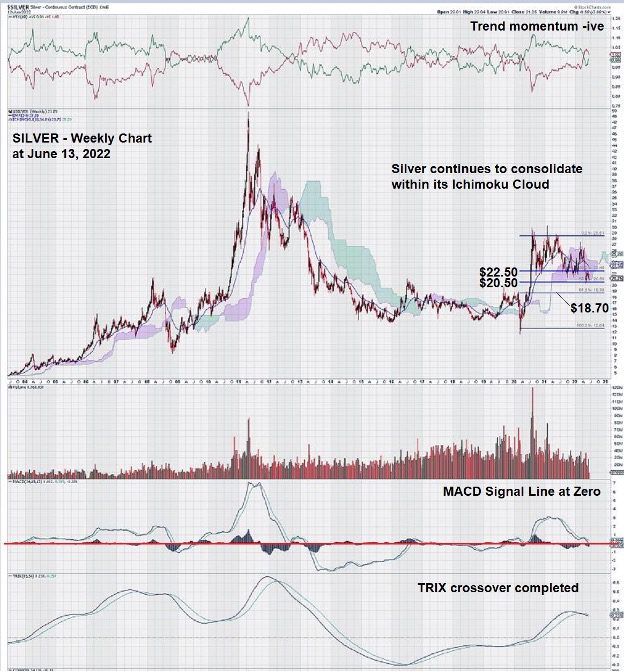
The weekly chart for silver is showing signs of stress:
- MACD is testing the zero line.
- TRIX, on long-term settings, has crossed over its 34-week moving average.
- Fibonacci retracement level is now 50%
- Box Range consolidation between $22 and $28 is now broken to the downside.
- Trend momentum is negative.
Silver Price Analysis Summary and Wrap-Up
The weekly chart for silver is starting to accumulate a series of negative technical signals, despite remaining within the Ichimoku Cloud – a sign that current trading is relying primarily on the “shadow” of past trading.
In the absence of any positive news, the weekly chart for silver has the look and feel of a chart that is being “ground down by time.”
We note that our observations in February that a sideways consolidation was underway were correct. Today we see the culmination of that consolidation with pressure to the downside that threatens to break silver out of its Ichimoku Cloud “price protection.”
It is particularly concerning to see both TRIX and MACD acting in concert.
The weekly chart for silver showed good promise for a better outcome back in March/April when it was testing the upper limit of the Ichimoku Cloud. However, now the price has deteriorated, and the lower Cloud level is being tested.
Investors and traders have become super sensitive to the actions of the Federal Reserve as they begin to battle inflation.
Higher rates continue to strengthen the $USD and push it beyond the multi-year resistance level of $1.03. Silver (and gold) are both finding it difficult to move higher with positive $USD sentiment in the marketplace.
– John Top, the technical trader