
Bitcoin Testing Key Support Level
Today, we shift our attention to Bitcoin. Here is the weekly chart that shows Bitcoin is testing a key support level on its weekly chart:
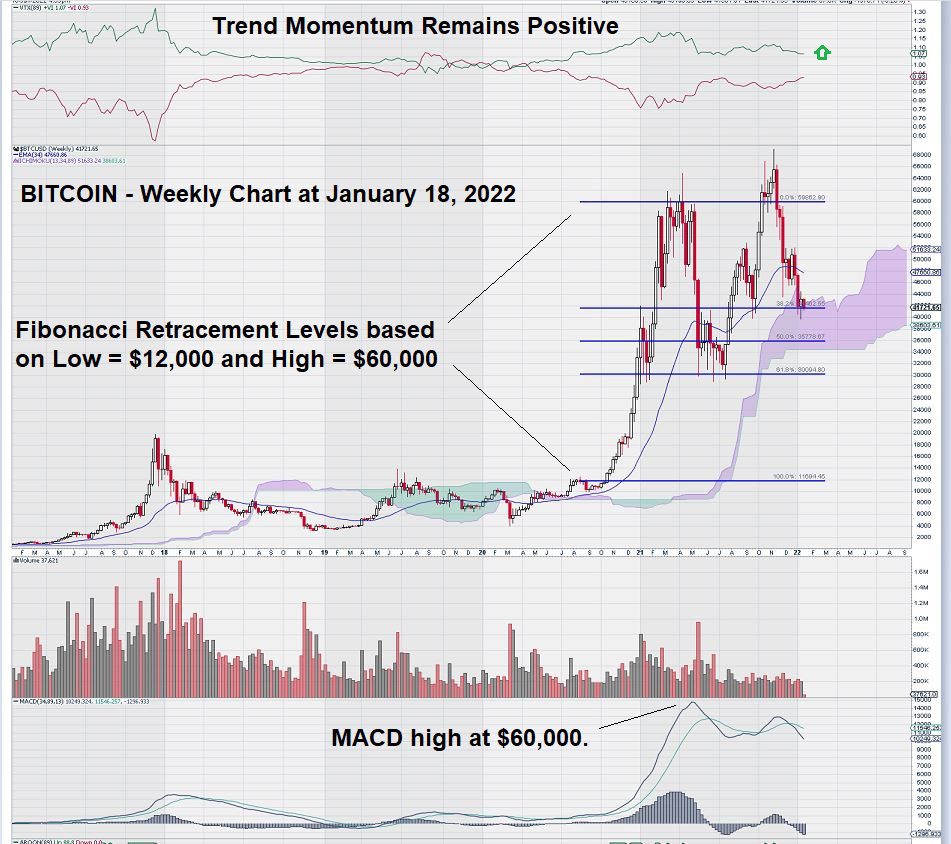
As with the weekly chart for gold, we have set our Fibonacci levels not at “lows” but rather at key multi-year resistance levels that previously held price in check and prevented it from moving higher.
Here is a weekly chart for gold from early October 2021 that shows why we chose $12,000 (a well-defined multi-year resistance level) as the Low for our Fibonacci studies of Bitcoin. Note the comparison:
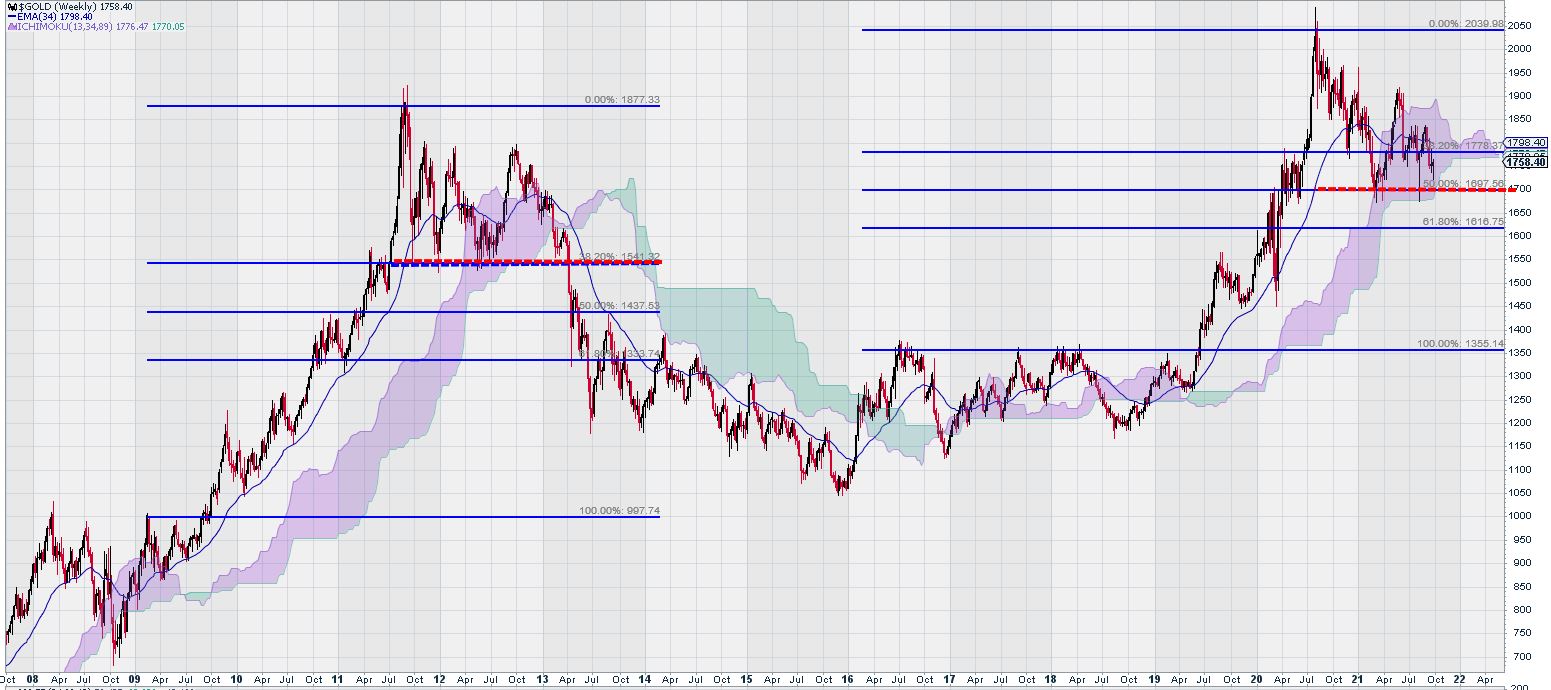
As noted, a key support level for gold is at $1700, shown with the horizontal red line on the RHS of the chart.
Turning our attention back to the weekly chart for Bitcoin, we make these observations:
(1) Fibonacci Retracement Levels are $42,000/$36,000/$30,000.
(2) MACD is currently negative with both signal line and trigger line above zero.
(3) Trend Momentum has remained positive even during a prior price decline.
(4) Previous price decline had a significant uptick in selling volume, as noted on large red candlesticks. Current price decline lacks volume.
(5) Ichimoku Cloud base is at $34,000. It will remain at this level until July 2022.
Summary & Wrap Up
Some investors have noted that Bitcoin is ideally suited for the use of Technical Analysis because its valuation is not derived from any underlying value. How is that for an oxymoronic statement?!!
In other words, the value of Bitcoin rests with what the “next buyer” will pay for it. Period.
Type in “valuation metric for Bitcoin” in a search engine, and you will be amazed at how many different ways investors and analysts are coming to conclusions about how much Bitcoin is “worth.”
For the record, we are not anti-Bitcoin or pro-Gold; rather, our analysis remains constant. We like using longer-term weekly charts with settings derived from Fibonacci numbers. Additionally, we follow trend momentum and MACD. The use of Ichimoku Clouds has shown us, over the years, that declines below them that occur after a multi-year advance must be respected.
And finally, properly applied Fibonacci levels are most useful in defining key areas of support and resistance.
We were able to make a correct “call” on the S & P TSX Global Gold Index as it topped out in 2012 (Ichimoku Cloud break-down), and further confirmation was noted in early 2013 (Decline below key Fibonacci support level). Subsequently, gold stocks entered a lengthy consolidation period that lasted seven years.
Our analysis of the weekly chart for Bitcoin tells us that it is at a key level at $42,000 and that there are several “layers of support” below. We continue to watch with interest.
-John Top, the technical trader