A Trillion-Dollar Trade Hiding in Plain Sight While the basic investors argue about chatbots, chips, and trillion-dollar byEquediaJune 7, 2026
By the Time You Read This, They’ve Already Bought More The most powerful institutions are buying it at a pace we haven't seen in over byEquediaApril 27, 2026
They Left a Fortune in the Desert. Now One Small Company Could Use It to Save America’s Military. This obscure material is now in the crosshairs of every nation, and there's only byEquediaApril 5, 2026
The Trillion-Dollar Plan The full details of the SpaceX merger and why it will change EVERYTHING byEquediaMarch 1, 2026
Commodities and Resource Copper Equedia Letter Metals and Mining UraniumMay 25, 2025 The Biggest Players Are In—Are You? The big money is pouring money into THIS to rewrite the geopolitical landscape
Commodities and Resource Copper Equedia Letter Gold Investment Ideas Metals and Mining SilverApril 4, 2024 Another Way to Profit from the Hercules Discovery The Hercules discovery represents the first significant porphyry copper system
Copper Metals and MiningJune 23, 2022 Copper Price Continues to Erode As Economic Uncertainty Persists In March, there were signs the copper rally could continue after a favorable
Copper Metals and MiningMarch 8, 2022 Raising the Copper Flag Several positive technical indications show that copper may be starting another
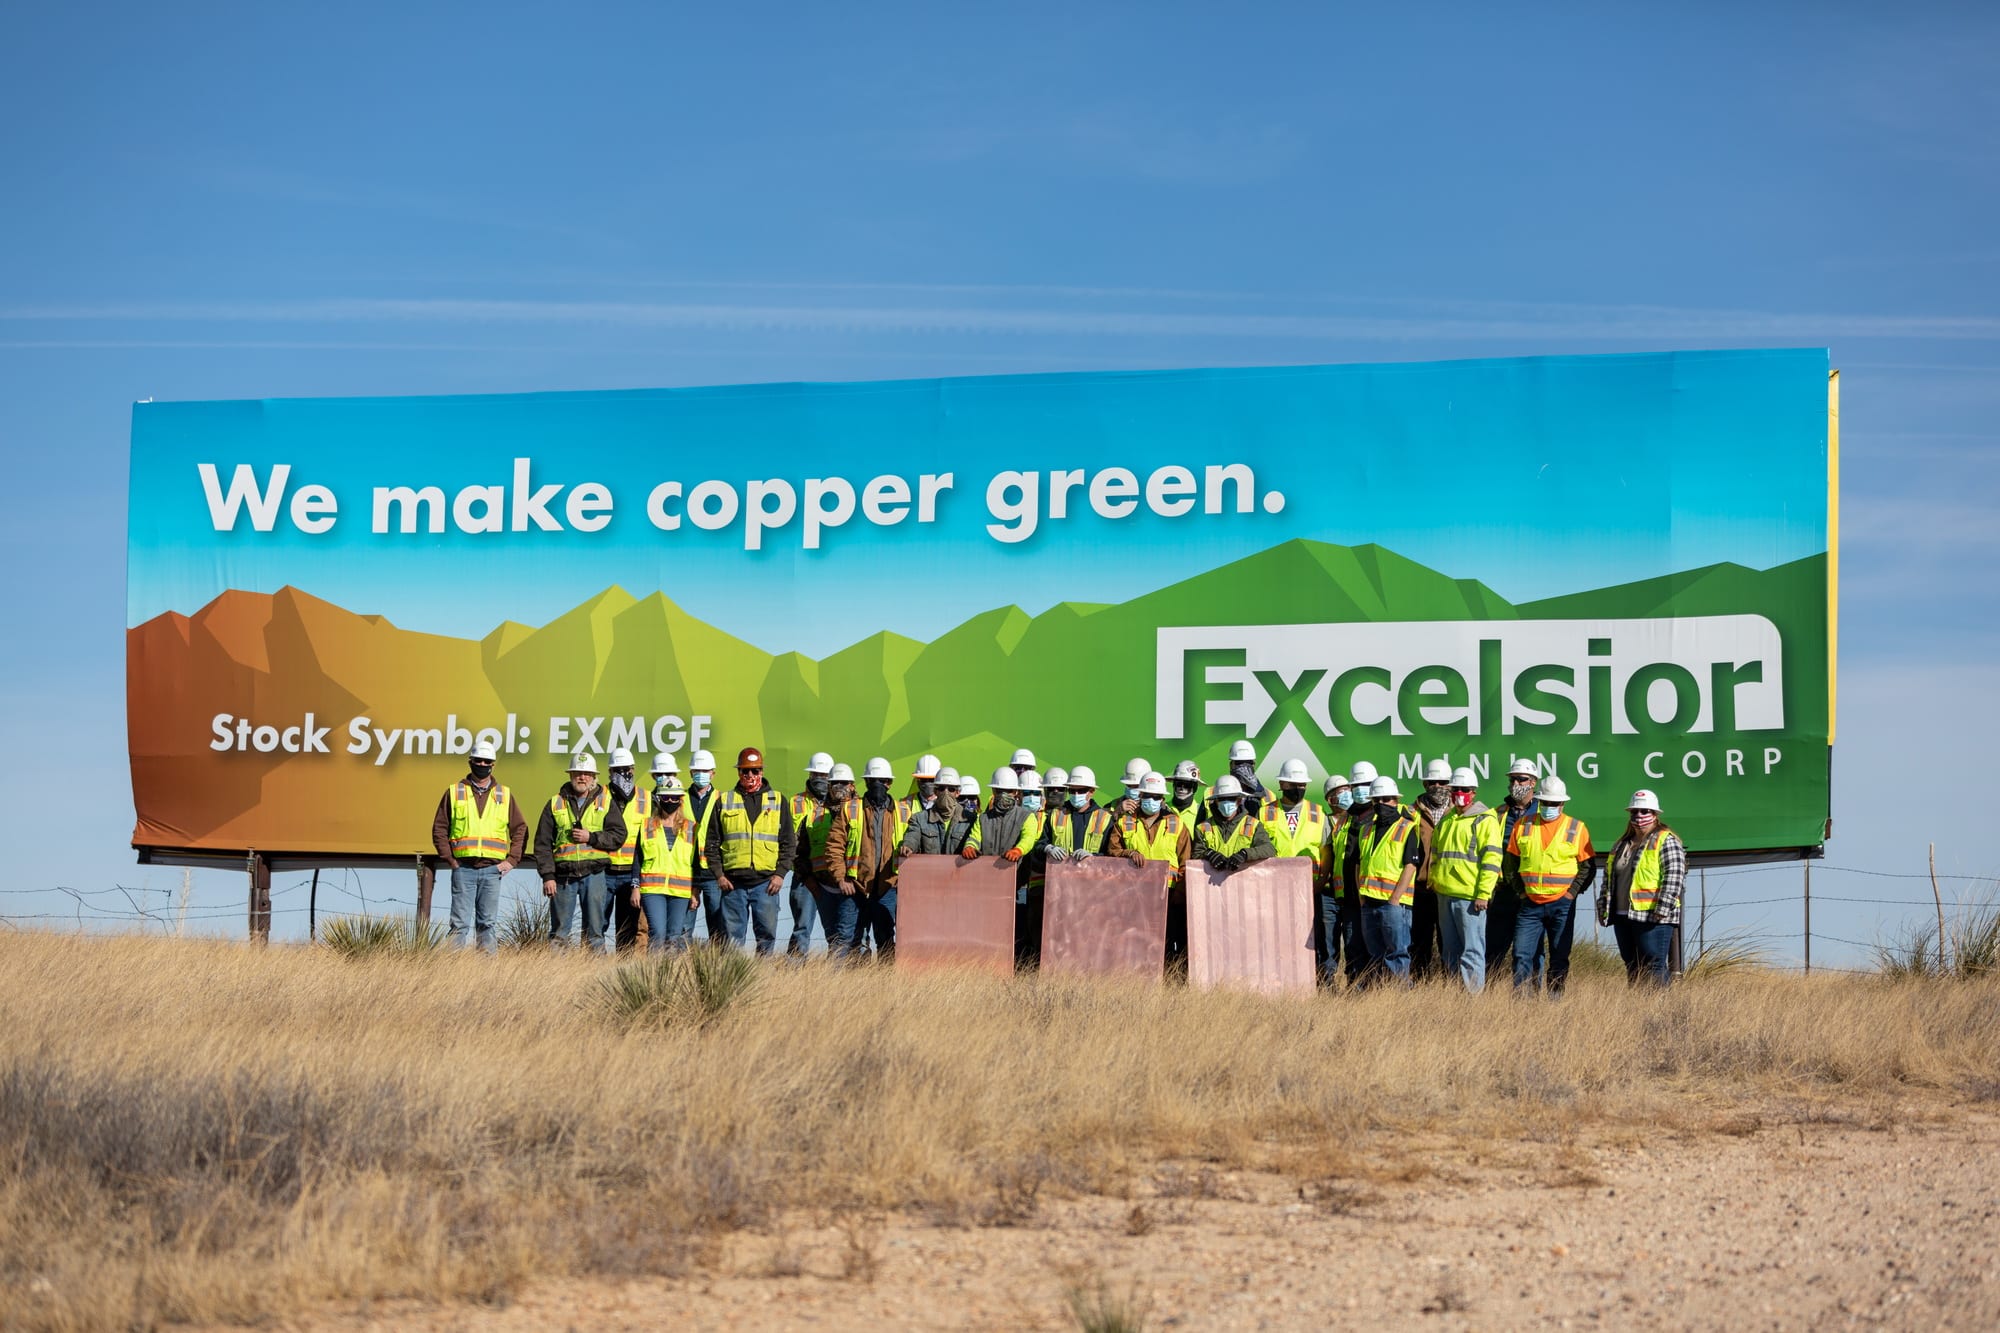
Copper Instructional Metals and Mining Stock Charts Technical AnalysisDecember 30, 2020 Excelsior Mining: The Daily Chart Normally, we like to look at weekly charts to determine potential breakouts
Commodities and Resource Copper Instructional Investment Ideas Metals and Mining Stock Charts Technical AnalysisDecember 10, 2020 Excelsior Mining Shares Responding: A Look at the Technical Stock Chart We like the way Excelsior Mining (TSX: MIN)(OTC: EXMGF) has been trading lately
Commodities and Resource Copper Instructional Investment Ideas Metals and Mining Stock Charts Technical AnalysisNovember 24, 2020 Copper and Copper Stocks Chart Analysis: Looking for a Breakout? We have been predicting a copper breakout from a macro and political