When we last reviewed the weekly chart for copper in March, there were signs that the price rally was set to continue after a favorable technical pattern was completed.√ The chart pattern was setting up to be a pennant, which, when completed to the upside, meant that copper still had room for a further escalation in its price.
This is how we interpreted the chart for copper in March:
“We have often said that technical analysis involves the convergence of various signals that lead to the same conclusion.
For copper, these signals came as the price was starting to break above the $3.00 level.
Several positive technical indications indicate that copper may just be starting another long and sustained move to the upside.
Consider that MACD has yet to have the signal line cross over the trigger line, but with a few more weekly closes at or above the current level, we would expect to see positive confirmation.”
Instead, copper took a turn downwards. Now examine the copper chart to see if there were any clues that we may have overlooked.
Let’s start with a close-in look at the weekly chart for copper:
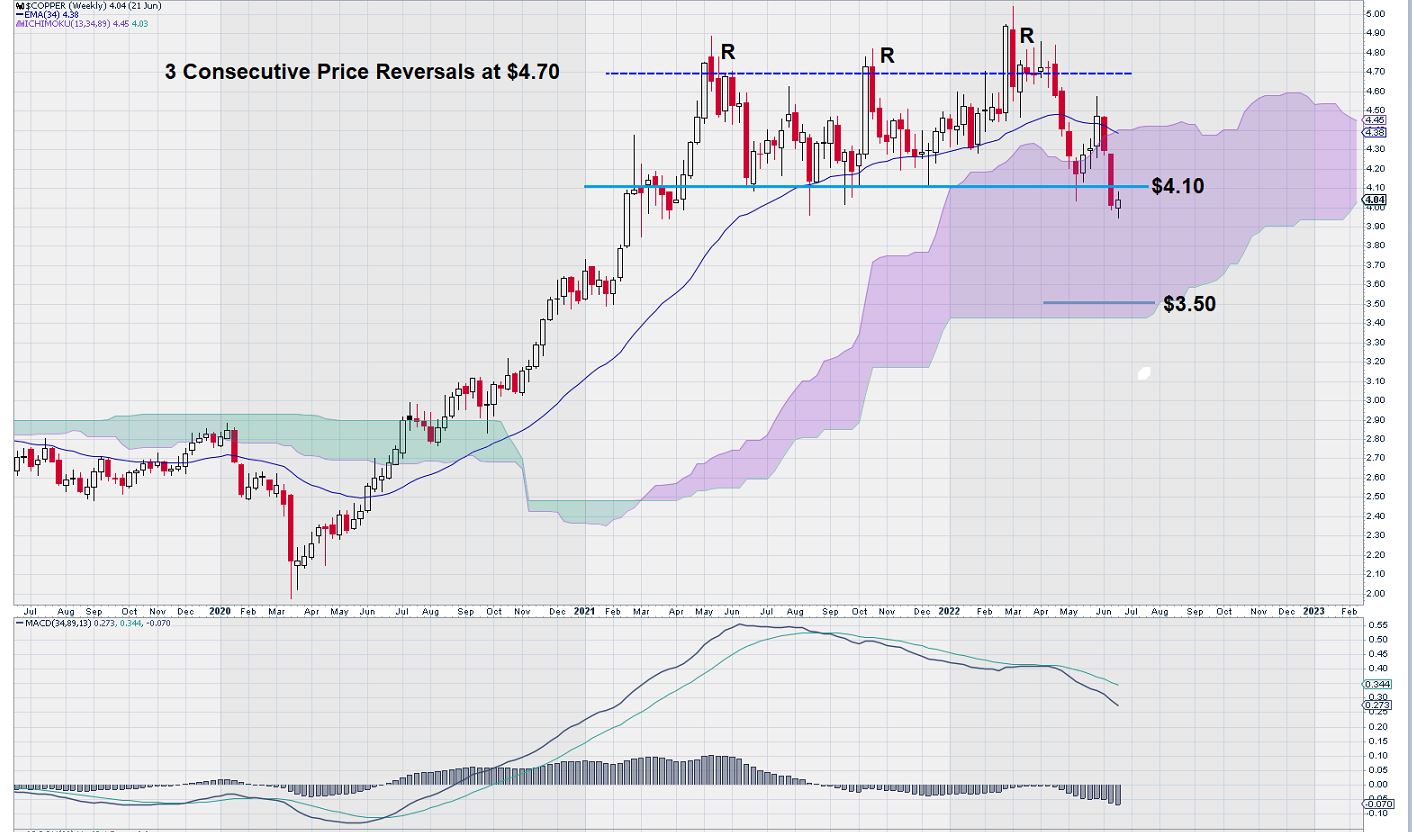
On this chart, we notice something that we have seen before and written about many times: “3 Taps and Out”. In this case we have a “failed pattern”. The copper price did not break out above the $4.70 level.
We know from conventional technical analysis that triple top patterns usually form in a shorter time period, but this one took longer.
Here is a definition of the triple top reversal pattern given by Stockcharts.com:
“The Triple Top Reversal is a bearish reversal pattern typically found on bar charts, line charts and candlestick charts. There are three equal highs followed by a break below support. As major reversal patterns, these patterns usually form over a 3 to 6-month period.”
The support level for copper is clearly denoted at the $4.10 level. Last week copper closed below this level. Also, MACD continues to present a weakening picture as the signal line remains below the trigger line. However, for now, both lines remain well above the zero line, which still allows time for consolidation and price recovery.
Now we step back in time and take a longer look at the weekly chart for copper:
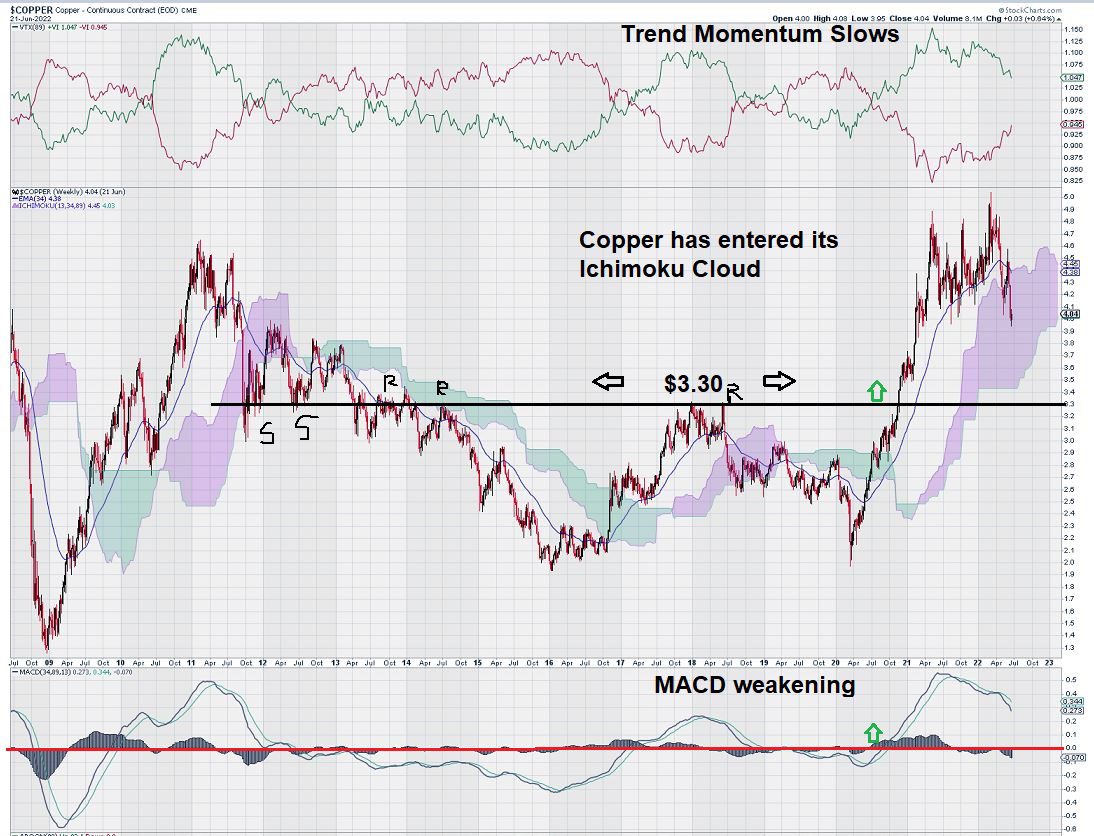
This chart shows us that the copper price has entered its Ichimoku Cloud. Therefore, it will be a negative indication if the decline in copper prices takes the price level below the base of its Ichimoku Cloud.
Remember what the Ichimoku Clouds represent. They show exponential moving averages plotted forward in time and are very helpful in establishing levels or areas on charts where there is support/resistance that other technical signals do not recognize.
Our charting history with the use of Ichimoku Clouds has taught us that one needs to exercise caution once the price falls below the Cloud after remaining above it for an extended period of time. This is now the case with copper.
Finally, we show the Fibonacci Retracement Levels for Copper, taking into account the most recent high/low:
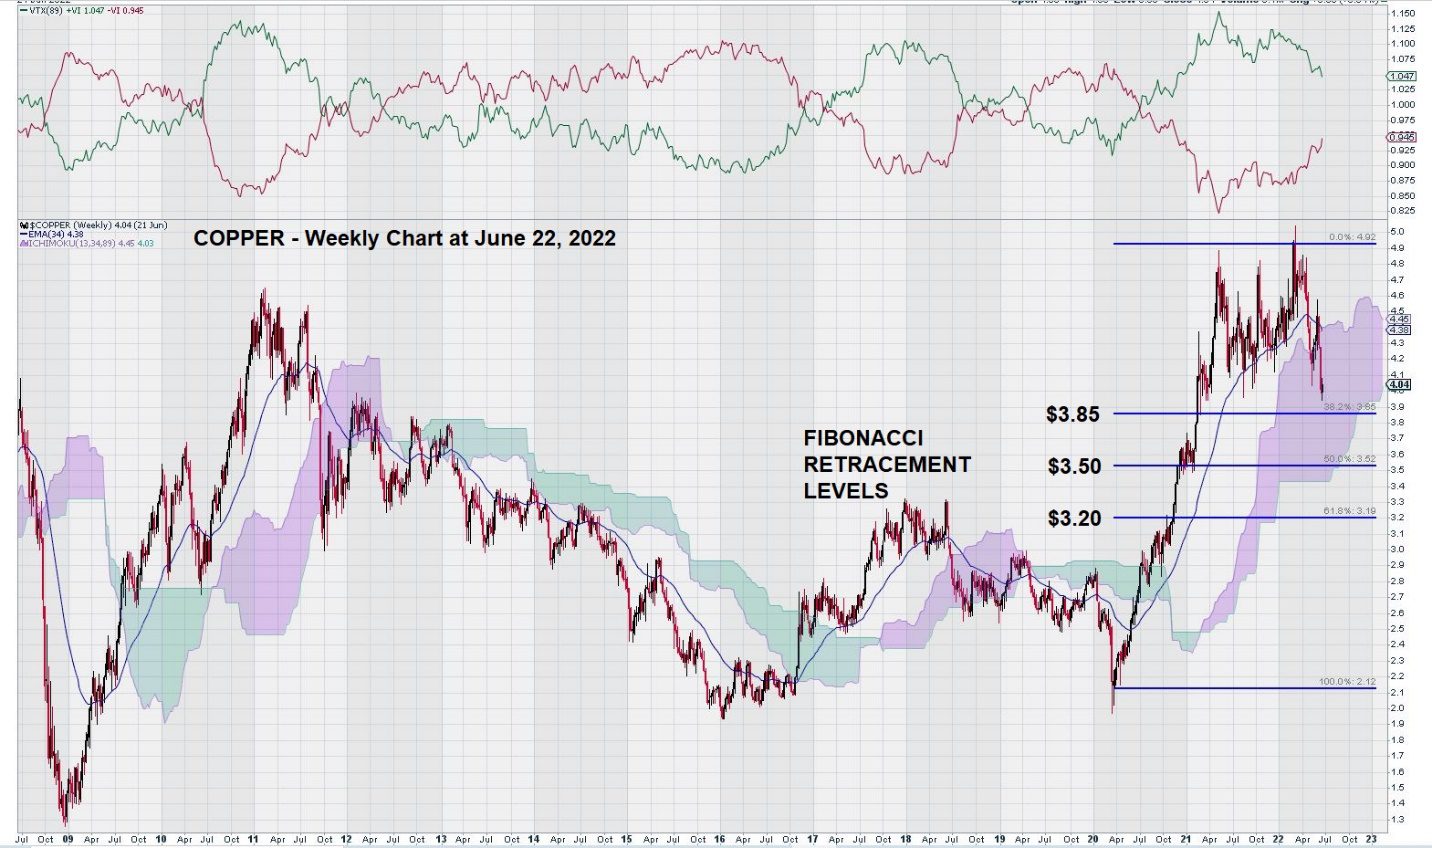
This chart indicates that we need to keep the $3.50 level in mind as a key level as it represents a 50% retracement in the recent move up in the copper price.
Copper companies, large and small, have followed copper down. Here is a weekly chart of FCX, a widely held copper company:
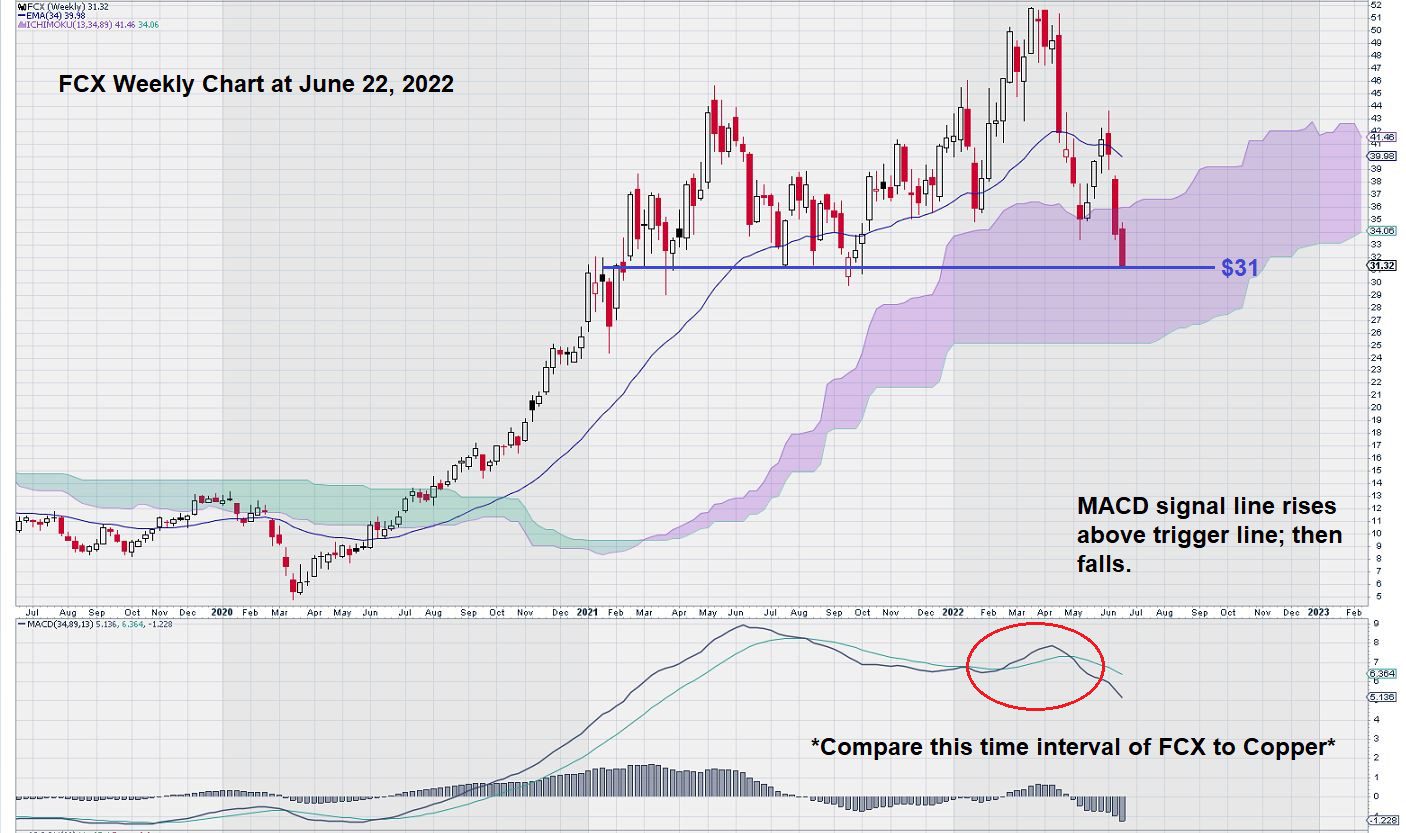
Notice that MACD provided a better response than copper, which did not show the signal line re-crossing the trigger line.
(See the first chart in this article.)
Summary and Re-Cap
There are three downside levels for the copper price that are important in the near term:
- Consecutive weekly closes below the Ichimoku Cloud,
- Consecutive weekly closes below $3.50,
- Consecutive weekly closes below $3.30.
There is good technical support for copper between $3.20 and $3.30.
A prevailing theme amongst financial pundits is “uncertainty .”There is little agreement on how inflation will affect the economy.
This led to talk of a mild recession versus a strong one; a soft landing or a hard landing.
The weekly chart for copper will, in the future, help resolve this question.
After all, copper is the barometer for economic health due to its use in homebuilding and construction.
– John Top, the technical trader