
Copper prices lunged forward on Friday to close at $4.94.
Here is what the weekly chart for copper looks like:
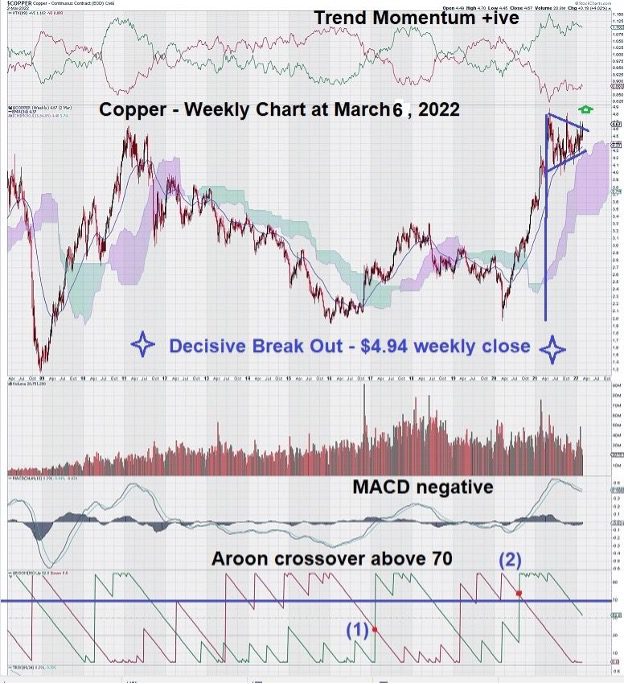
We see that copper made a significant break-out with a strong close last Friday to close above the “pennant,” as shown. We did not see these types of patterns in the past as they were not generally evident in the “long consolidation patterns” that we focus on discovering and interpreting.
These consolidation patterns include ascending triangle and box range patterns.
We note with interest that, once again, Aroon has lived up to its namesake of “Early Dawn.” Over the past six months, we have started paying more attention to Aroon.
It seems that when Aroon records a crossover above the 70 level, the signal is early, it is strong and unmistakable, and, as we have seen, it is reliable.
With your eye, draw a vertical line up from the Aroon crossover point on the chart denoted by (2) to see how early the buy signal was for copper. A few weeks later, MACD confirmed the Aroon signal by way of the signal line and trigger line, both crossing above the zero line.
Note also that trend momentum, shown by the “green over red” line above the price chart, become positive as well.
We have often said that technical analysis involves the convergence of various signals that lead to the same conclusion.
For copper, these signals came as the price was starting to break above the $3.00 level.
Now there is another strong signal that tells us that copper has a chance to make additional gains. The next few weeks (Friday closes) will help to provide further clues about future price direction.
Summary and Wrap-Up
Speakers at metals investment conferences often talk about the “stealth move” in commodities. They are referring to that period when commodities start to move up after long periods of price action that is either negative or neutral. In other words, market participants don’t accept that prices will remain on an upward trajectory but rather that they will fall back. This is the so-called “wall of worry.”
Copper tested the $4.50 level in 2011 and was repelled from it. In the past year, copper consolidated between $4.25 and $4.75. During the past year, it was obvious that the sentiment of traders was equally divided between bullish and bearish. Now, something has changed. The Bulls are in control of the Copper market.
The close on Friday tells us that we should pay close attention to how it trades over the next 4 – 6 weeks.
Several positive technical indications indicate that copper may just be starting another long and sustained move to the upside.
Consider that MACD has yet to have the signal line cross over the trigger line, but with a few more weekly closes at or above the current level, we would expect to see positive confirmation.
We use long “trend settings” based on Fibonacci numbers when we look at weekly charts. That is why a positive crossover for MACD is so important – it takes into account many weeks of data that more often than not captures when the trend changes occur.
– John Top, the technical trader