
Perfect Alignment With Fibonacci Retracement Levels
For the past year, gold stocks have been consolidating within defined Fibonacci Retracement Levels on the weekly chart for the S & P TSX Global Gold Index. As a result, gold stocks are now set to move higher as the “Fibonacci Consolidation” is completed.
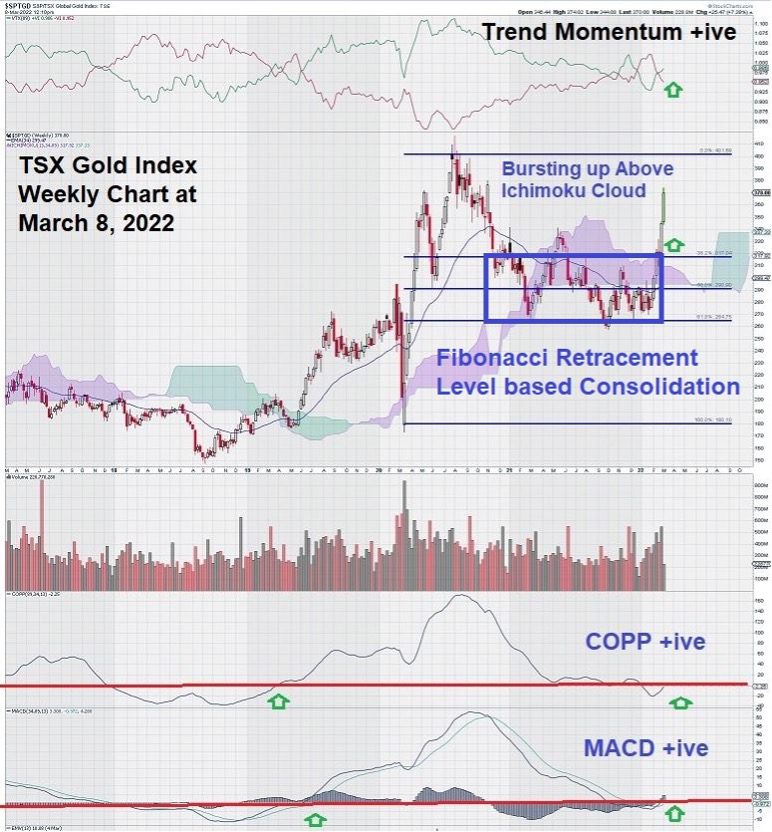
Let’s get straight to the weekly chart for the TSX Gold Index ($SPTGD) for our review:
When we “look” at charts, sometimes we can see the pattern even before confirming it by using technical indicators. That is why the TSX Gold Index “just looks right.”
Now, what exactly do we mean by this?
Our chart trained eye takes in the low in 2000 and the subsequent high in the same year. Then, we see a steady, almost measured decline to a level in early 2021.
Next, a recovery in price, followed by another decline to the same low level as before. Finally, we have the weekly trading action of the past few weeks and two strong consecutive candles (we often mention this prerequisite of “two consecutive candles” as our break-out signal).
Again, we say something about this chart “just feels right.”
And now we see why…
We start to layer on our technical indicators and the Fibonacci Retracement Levels. What do we see?
A perfect fit.
Other than a false break-out in 2021, the consolidation fits within standard Fibonacci Retracement Levels. We note that the false break-out had a feeble positive candle (a hanging man) that could have signaled that a decline was imminent. A positive white candle followed this; then weak red candles came next over the next few weeks.
In summary, the false break-out had a negative candlestick, even though it was white and not red, followed by a positive candlestick.
A mixed-signal at best.
Compare this to the current break-out that shows two consecutive white candlesticks that were well supported by strong volume.
A classic break-out signal.
Then we note that the price chart is above the Ichimoku Cloud and that Trend Momentum has turned positive. Also, the Coppock Curve is set to give a confirmation with a return above the zero line. MACD is in a very good position with the signal line above the trigger line and both lines having just crossed the zero line.
In summary, there are many solid indications that gold stocks are on an upward track to test the previous recent highs in 2020 and the all-time highs the index reached in 2011.
Another final observation worth noting is that the Aroon indicator (not shown), which we highlighted in our recent article entitled “Raising the Copper Flag,” may have a chance to give a similar signal to the one on the weekly chart for copper. You will recall that Aroon UP crossed over Aroon DOWN above the 70 level.
This marked the point when strong Bears were completely overwhelmed by even stronger Bulls – a clear reversal of sentiment, not only from the Bulls’ perspective but also from the Bears who lost all desire to stand in front of the Raging Bulls.
Copper made a swift move from just below the $3.00 level to $4.75; from the point of the Aroon crossover.
Are gold stocks setting up for a similar strong upward move?
Aroon Down is currently above the 70 level, and Aroon Up is under 10. Remember that Aroon is different in that it measures time against price. The weekly chart for the TSX Gold Index includes some strong closes that are about to give a “vertical reading” for Aroon Up very soon.
Summary and Wrap-Up
Fibonacci Consolidations are not to be ignored.
Gold stocks have been very patient, trading sideways for the better part of a year. Now they are ready to respond to increased investor appetite in a world that is genuinely becoming more and more uncertain by the day.
Higher oil prices are driving up the cost per ounce of production for gold. Fuel and energy are two big cost inputs for the gold mining industry.
Gold mines are not immune to the impact of inflation.
What matters is margins. Gold must rise fast enough to keep up with or surpass underlying production costs for margins to remain stable or increase.
Gold producers are well aware of their cost inputs.
Let’s see, as time goes on, which ones can navigate currency fluctuations, input costs, and the challenge of meeting or exceeding production targets.
2022 is shaping into an excellent time to be a seasoned gold investor.
Regular readers of EQUEDIA have been well prepared to apply the technical analysis skills they will have learned on this website.
We close with the Boy Scout Motto: “Success is Where Preparation Meets Opportunity.”
– John Top, the technical trader
Disclosure: We own gold stocks.