The Hole That Refused to Quit 250 metres underground — past where these gold systems are supposed to die — a byEquediaJune 23, 2026
A Trillion-Dollar Trade Hiding in Plain Sight While the basic investors argue about chatbots, chips, and trillion-dollar byEquediaJune 7, 2026
By the Time You Read This, They’ve Already Bought More The most powerful institutions are buying it at a pace we haven't seen in over byEquediaApril 27, 2026
They Left a Fortune in the Desert. Now One Small Company Could Use It to Save America’s Military. This obscure material is now in the crosshairs of every nation, and there's only byEquediaApril 5, 2026
Copper Metals and MiningMarch 8, 2022 Raising the Copper Flag Several positive technical indications show that copper may be starting another
Market Outlook Metals and Mining Stock Charts Technical AnalysisSeptember 16, 2020 Weekly Chart for Copper Highlights THIS as a Key Resistance Level Information that is both timely and valid is a cornerstone to success in
Commodities and Resource Instructional Metals and Mining Stock Charts Technical AnalysisSeptember 2, 2020 Copper Price Chart – An Eye-Catching Positive Reversal Recently all eyes have been on gold – and to a lesser extent, silver
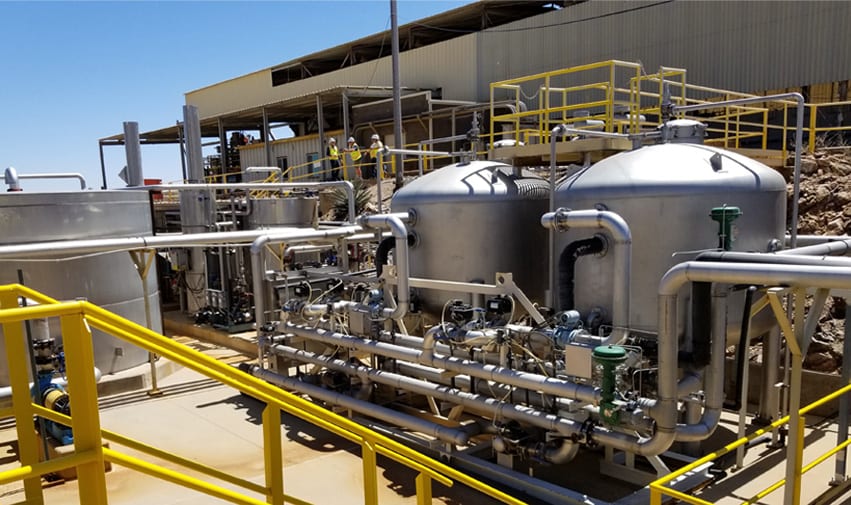
Metals and Mining Stock ChartsJanuary 13, 2020 In-Situ Copper Leaching Project in Arizona Transitions to Production – Cathode Copper Expected in Q1, 2020 The market seems to like the news coming out of Excelsior Mining Corp
Commodities and Resource Instructional Metals and Mining Stock ChartsDecember 10, 2019 Right on the Money: Re-Cap of Educational Segment 002 and Copper A week ago, in our educational segment 002, we took a close look at how a
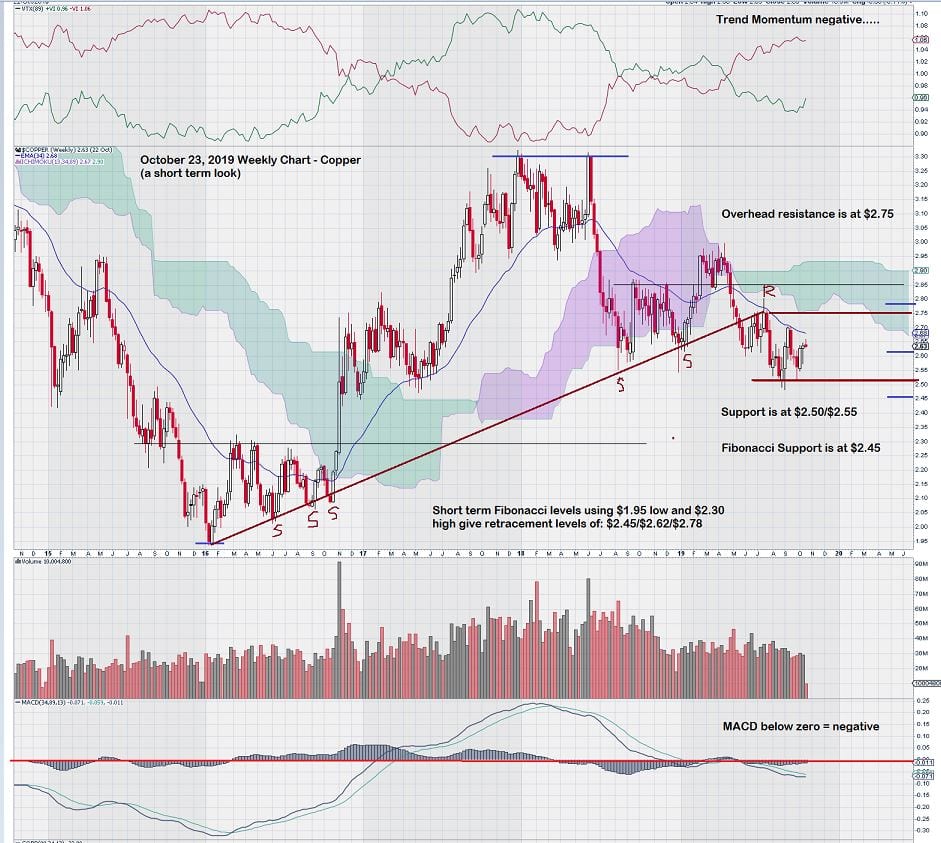
Commodities and Resource Instructional Market Outlook Metals and Mining Stock Charts Technical AnalysisOctober 23, 2019 Copper Slides Sideways – $2.75 Needed to Re-Awaken Bullish Interest Here's a look at the weekly copper chart analysis for October and why we need to