Weekly Chart for Copper Highlights THIS Price as a Key Resistance Level: Trend Momentum Continues to Strengthen
(Educational Segment 010)
Déjà vu?
Something about this long term weekly chart for copper made me think to myself:
“Now, where have I seen this chart pattern before?”
Then I remembered. It was in the weekly chart for the S & P TSX Global Gold Index – for the same time interval. Both charts are shown below; the gold index chart has not been marked up to show the support and resistance levels, but you can easily see the striking similarity.
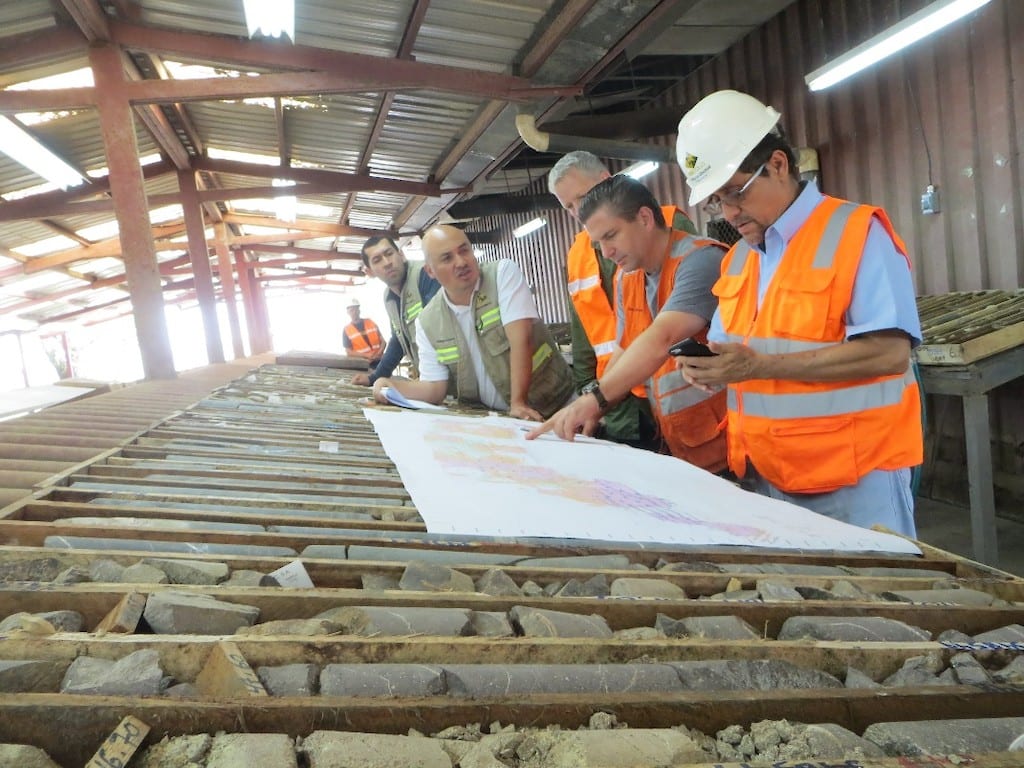
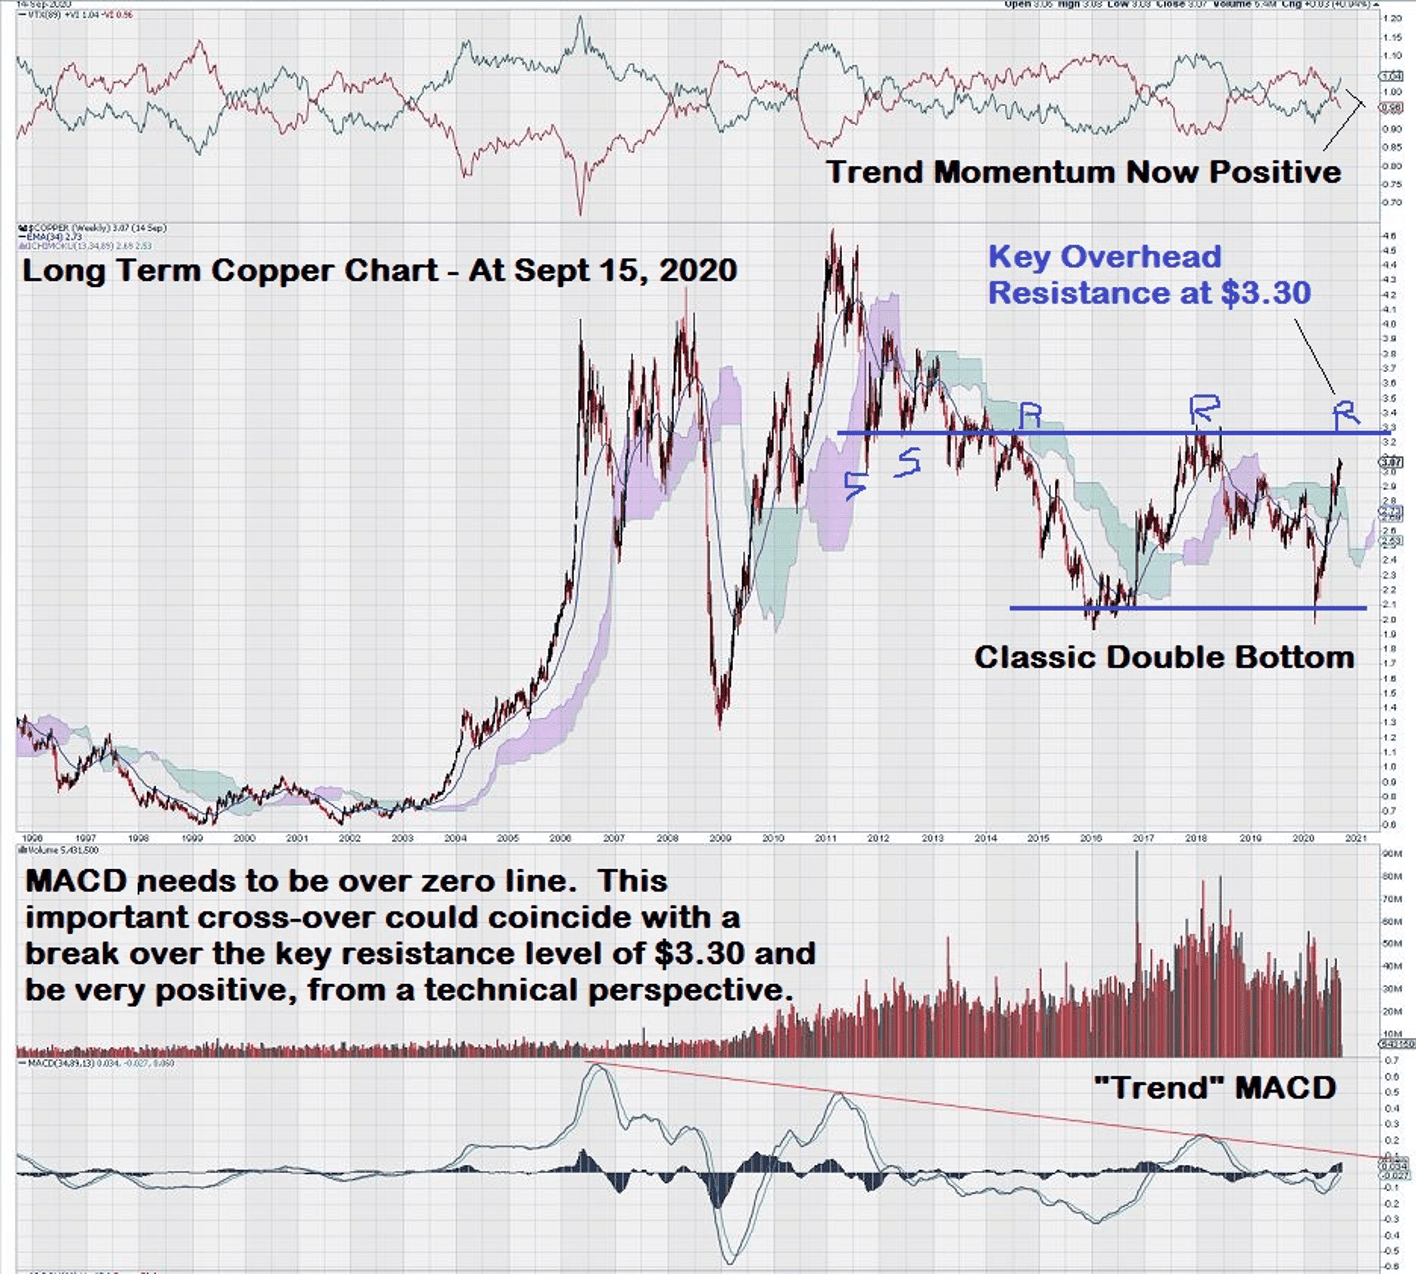
Weekly Chart for Copper
Weekly Chart for S & P TSX Gold Index at April 14, 2020
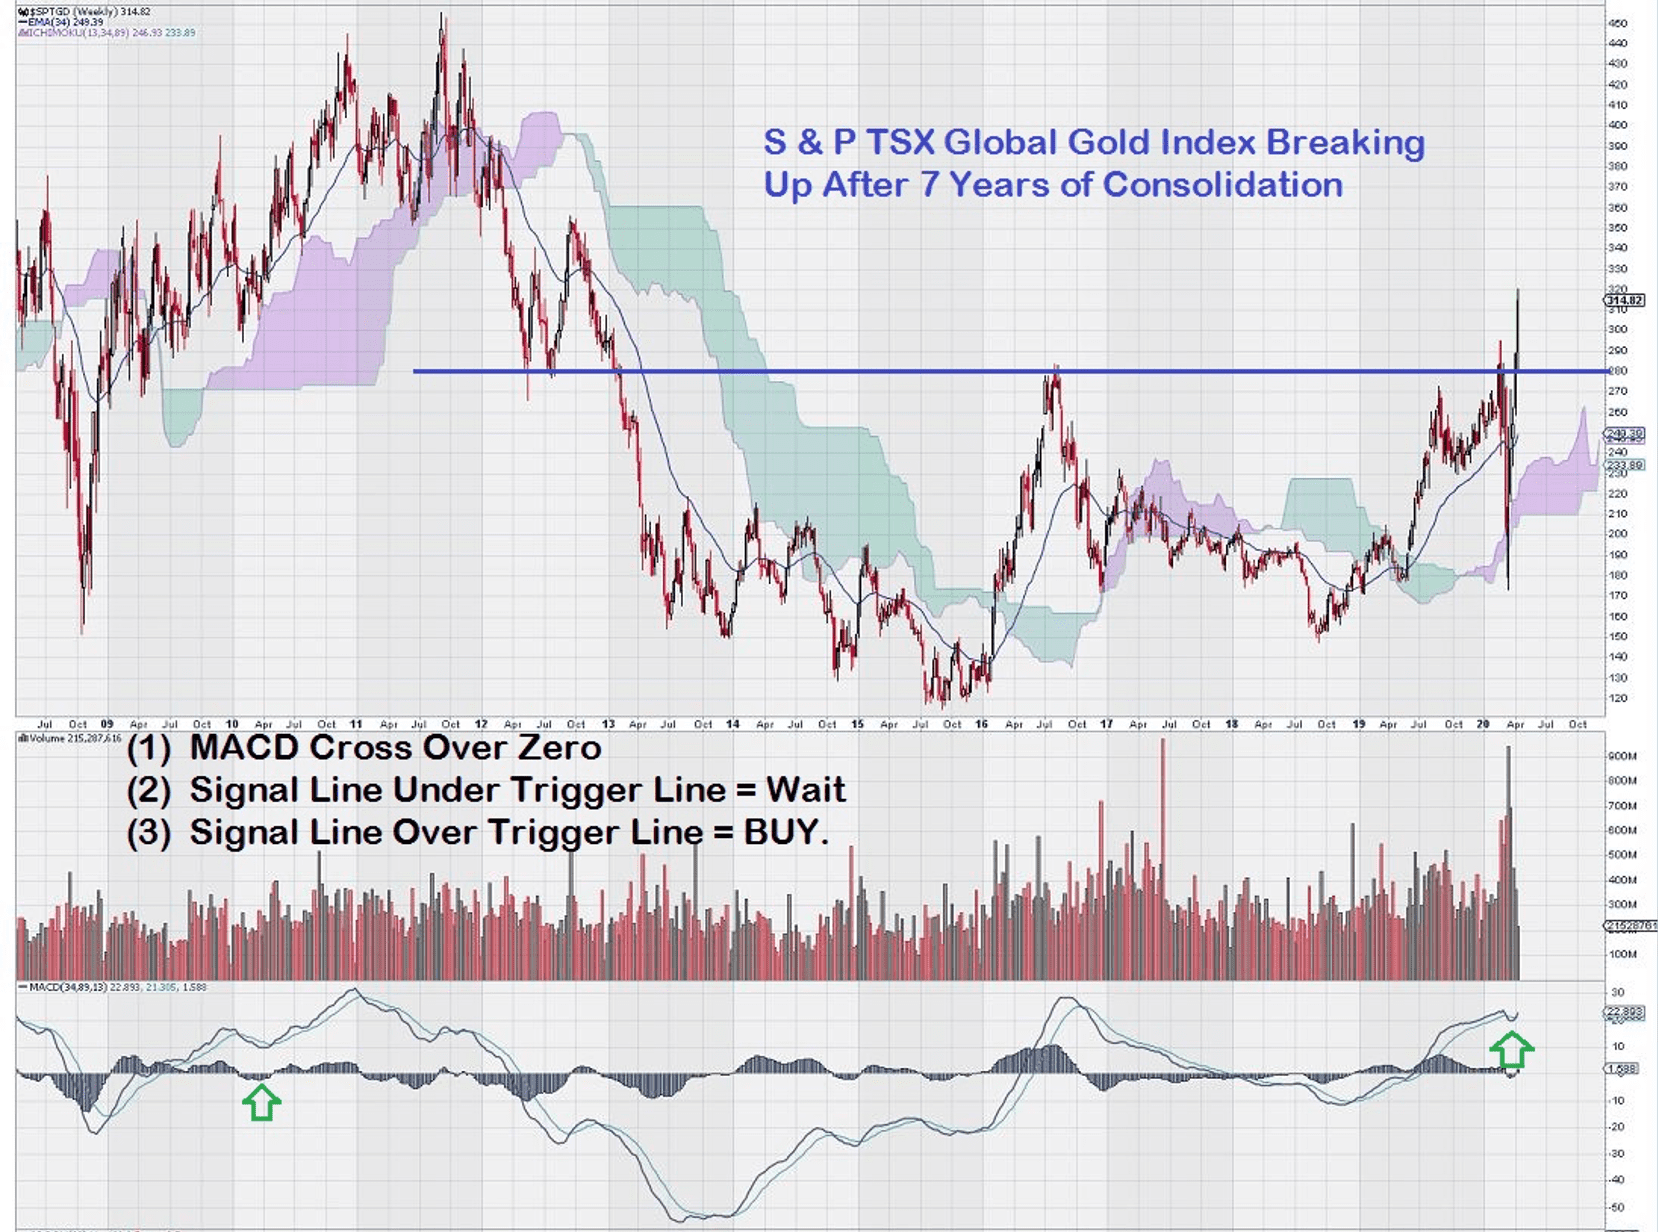
Notice in both charts how the 2008-low resulted in a 2011-high. The gold index recovered to its support level of 280 in 2016, while copper took a bit longer; it was in 2018 when the price of copper rose to its support level of $3.30. In both charts, predictably, prior support defined future resistance.
The gold index chart broke out and up above its key level of 280 in early 2020. It continues to perform well, trading at 390 today.
Copper has yet to break above the key $3.30 level. The close trading patterns of the copper chart to the gold index chart should be a strong and positive signal to base metal investors.
A few days ago, we made the “fundamental case” for why investors should turn their attention to base metal companies. Now, we present the technical case. However, the technical signals have not yet confirmed the break-out – after all, the $3.30 resistance level is still intact.
Equedia Readers Should Track the Copper Price Signal
This is what we continue to watch closely so that readers of Equedia can remain informed on a timely basis to make the necessary investments to profit from the coming rise in prices of base metals, and in particular, to the rise in the price of copper.
Information that is both timely and valid is a cornerstone to success in profitable investing. We have identified the correct “signal.” Now, all we have to do is be patient and wait for it to confirm that copper, like gold stocks, is on its way to test old highs.
-John Top, the Technical Trading Expert