Copper Slides Sideways – $2.75 Needed to Re-Awaken Bullish Interest

Here’s a look at the weekly copper chart analysis for October and why we need to see a coppper price of $2.75 to reawaken bullish interest.

Fully Discounted and Orphaned Copper Deals Worth a Look for Patient Long Players?

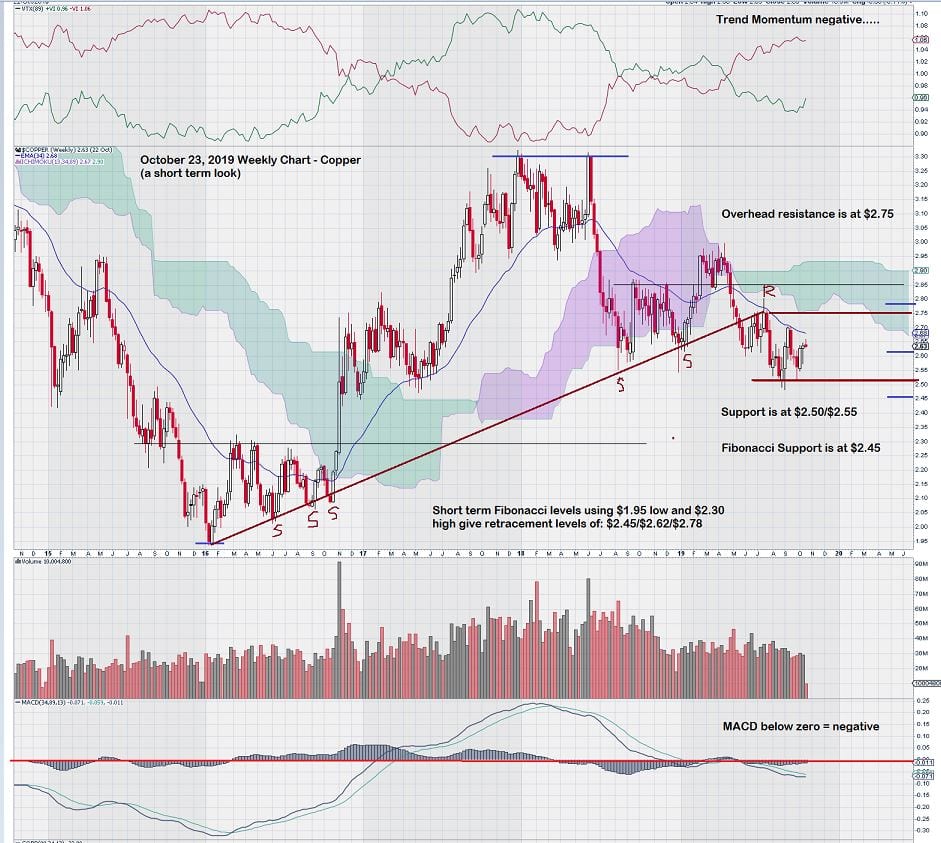
Here’s a look at the copper chart analysis for October. The simple fact is that copper has negative trend momentum and a negative MACD reading on weekly charts with trend settings; this needs to improve before price gains can be achieved.  In the meantime, the market is imposing severe discounts to copper projects held by juniors that have no way to advance them except through unacceptable dilution due to very, very low share prices.

Private equity groups are in the process of evaluating these deals.

Total
0
Shares
Leave a Reply

Your email address will not be published. Required fields are marked *

Prev
Silver Chart Analysis for October 16, 2019

Silver Chart Analysis for October 16, 2019

A local broker contacted me to take a look at silver and here is a weekly chart

Next
Waiting for the Golden Moment: Time to Buy Gold Stocks?

Waiting for the Golden Moment: Time to Buy Gold Stocks?

Is it time to finally buy gold stocks?

You May Also Like