Is it Time to Start Considering Gold Stocks?
By John Toporowski
Some time ago I read that gold stocks, by market cap weighting, make up less than 1% of all stocks. This simple observation explains why there is such volatility in the gold equity market – there just are not enough gold stocks to satisfy demand for them when demand starts to increase.
Despite central banks conferring “reserve status” on gold by way of their successive monthly purchases, the majority of investors have dismissed investing in gold or gold stocks. Why?
In the New World of digital “everything”, its detractors would have us believe that gold remains an ancient relic – stuck in the past. But is it?
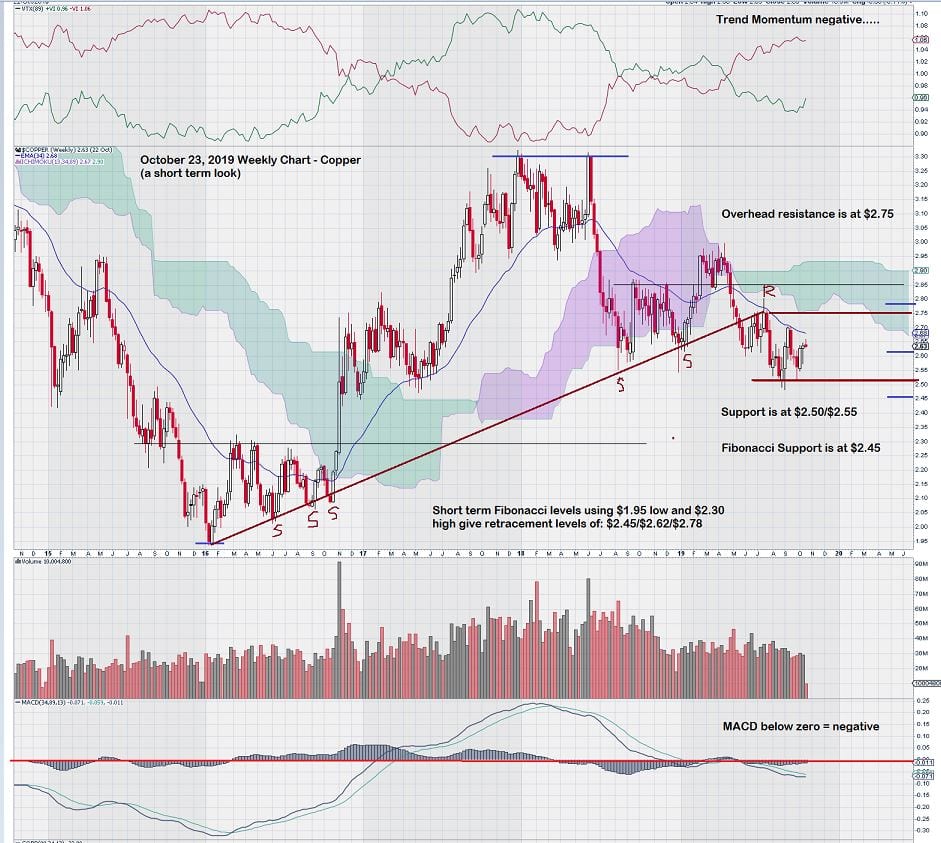
Since breaking out and up from a 6 year trading range with an upper bound of $1350/$1375, gold has been trading with renewed strength. Historically, gold has been strongly negatively correlated to the $USD. However, this lock-step relationship may be changing….both the $USD and gold have been advancing together in 2019.
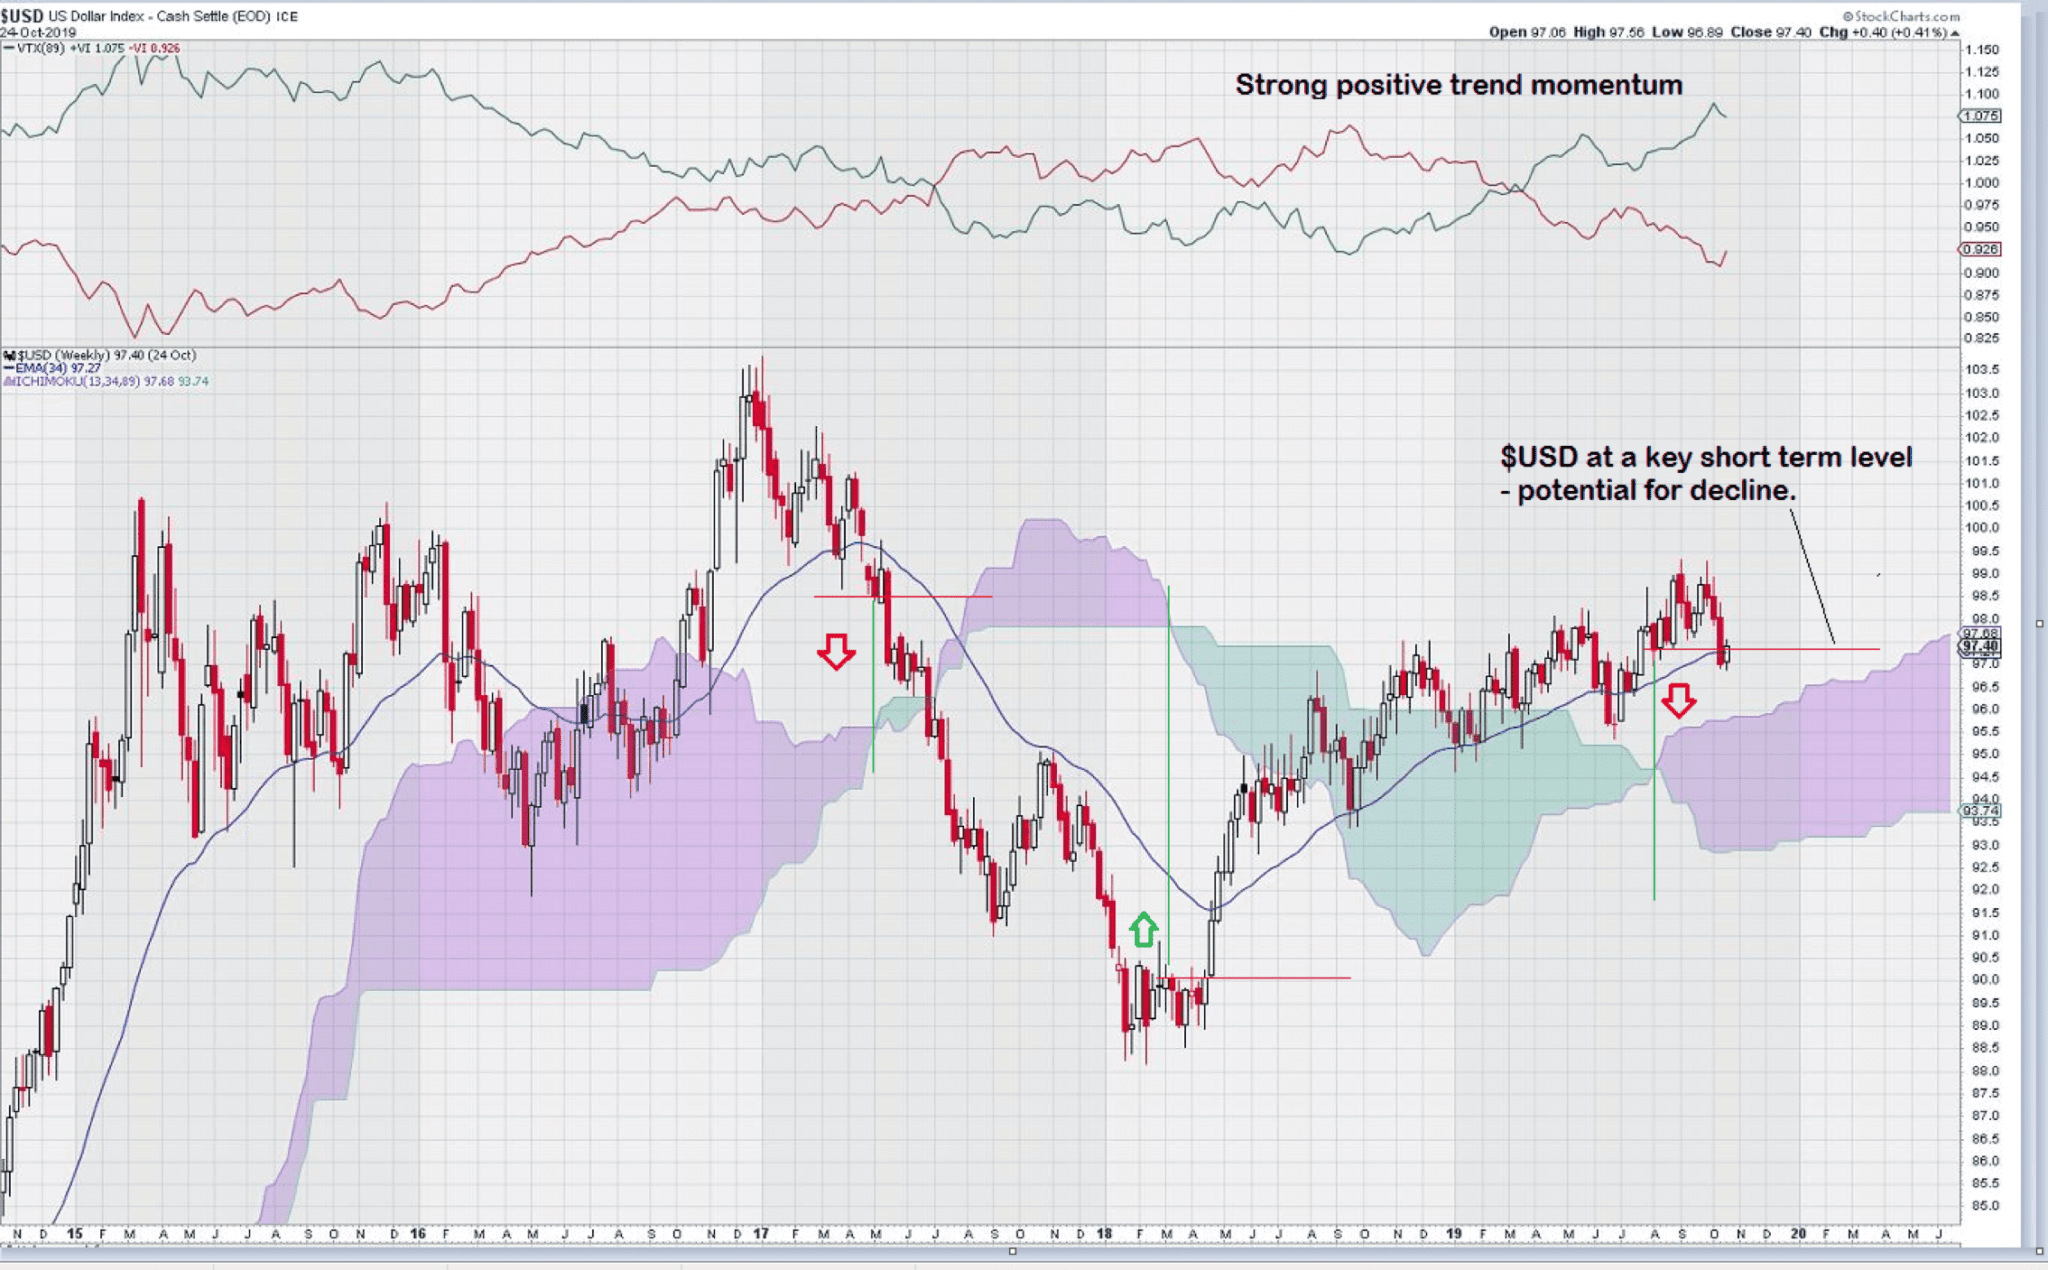
The $USD is at another inflection point on a short term chart. Trend momentum is strong and the chart is showing a pattern of higher highs and lower lows over the past year. Over the next few weeks, the trading over the narrow range of $0.97/$0.98 will influence future direction.
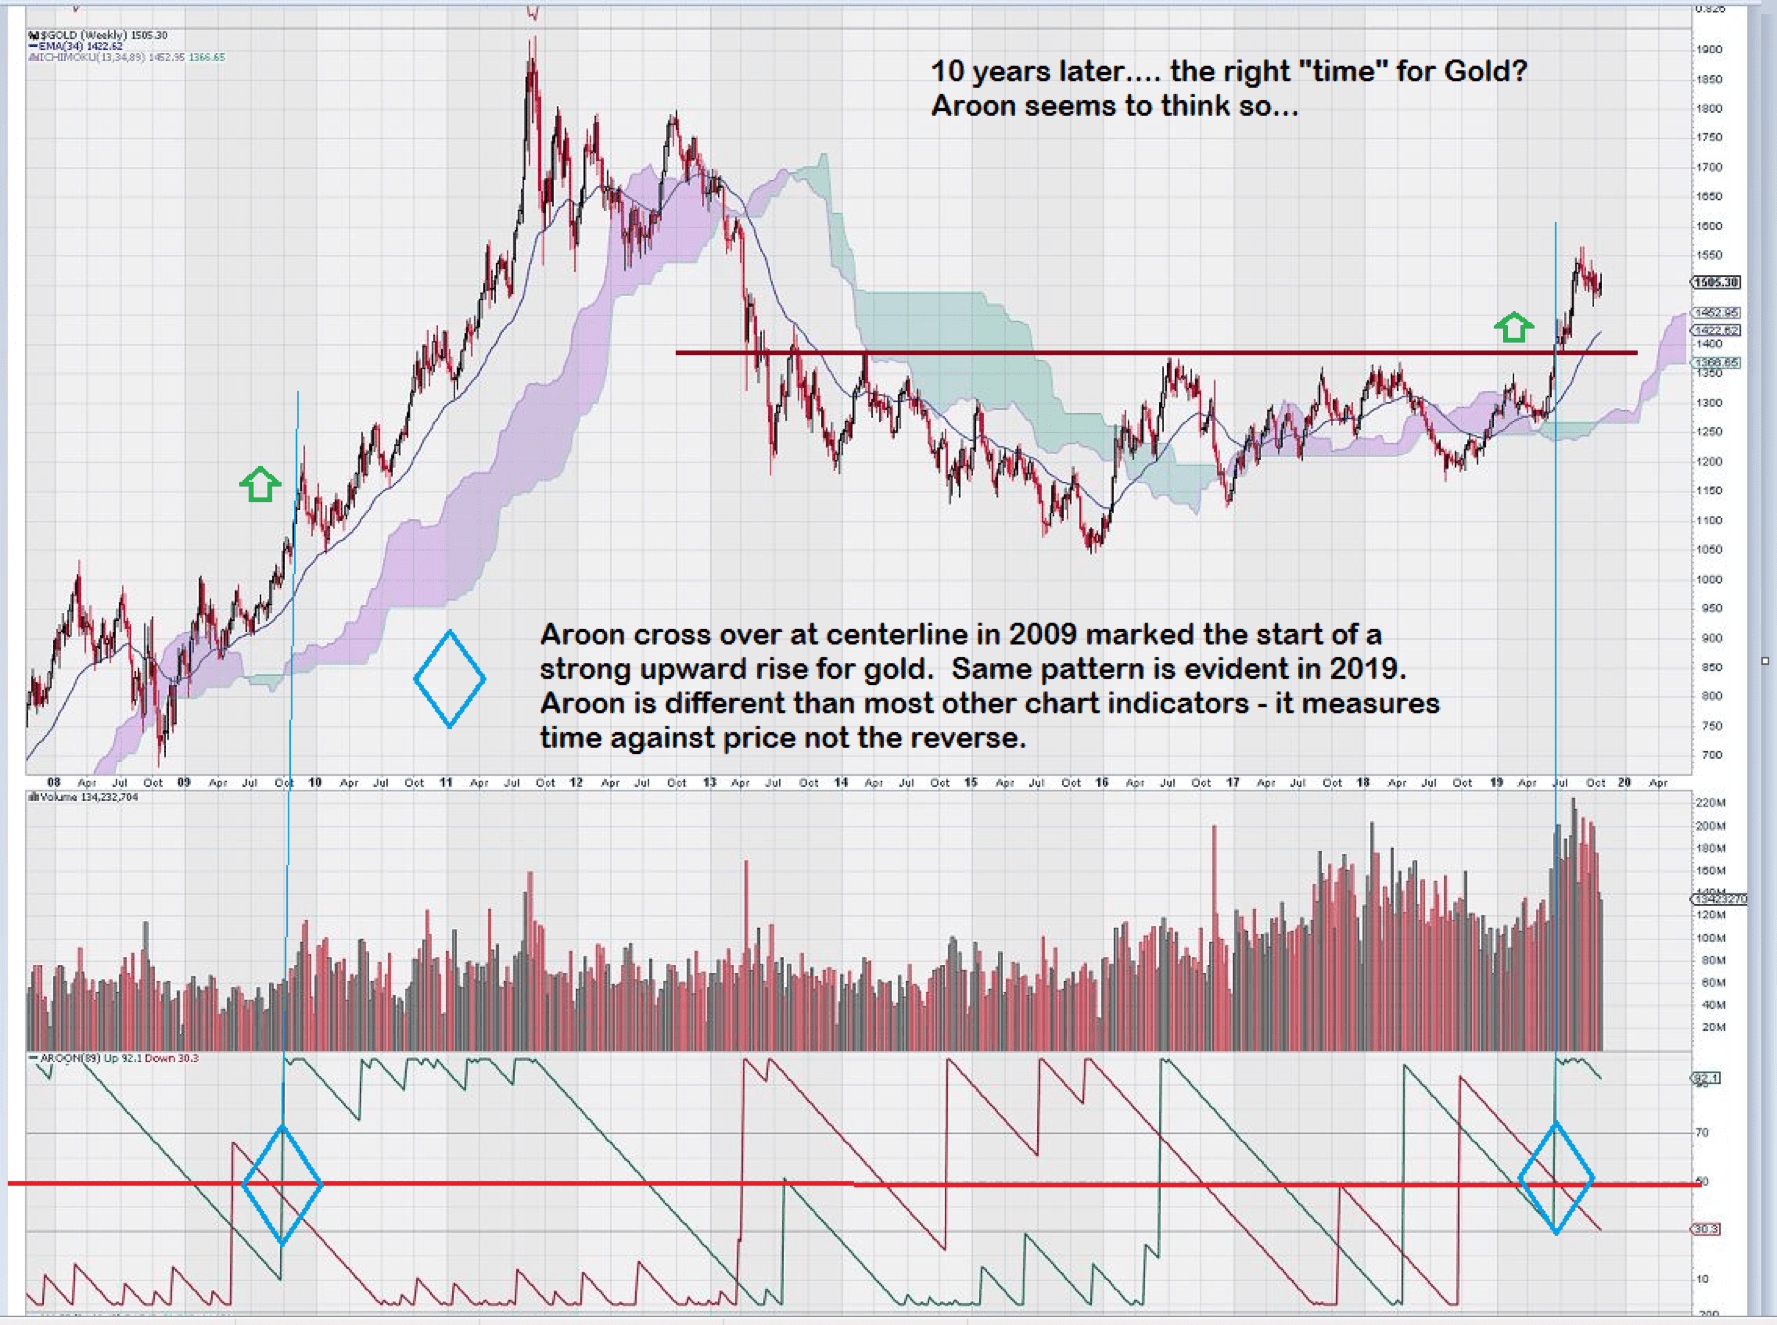
An obscure technical analysis indicator, Aroon, which measures new highs and lows of price in terms of time is used to identify trend changes. For gold, which has been trading sideways for the past 6 years, this new “trend” is up.
The price of gold is sometimes driven by sentiment. Just last month something quite profound happened in the overnight commercial paper market – the usual buyers were unusually absent. We all remember how, in 2008, this quickly became a very, very large concern. To use a totally overused phrase: “But this time was different!”. And it really was. The FED, having been caught flat-footed once was having no part of it a second time.
The FED sprung into action and injected the necessary funds to ensure that liquidity was readily available.
This was the biggest overnight repo yet!
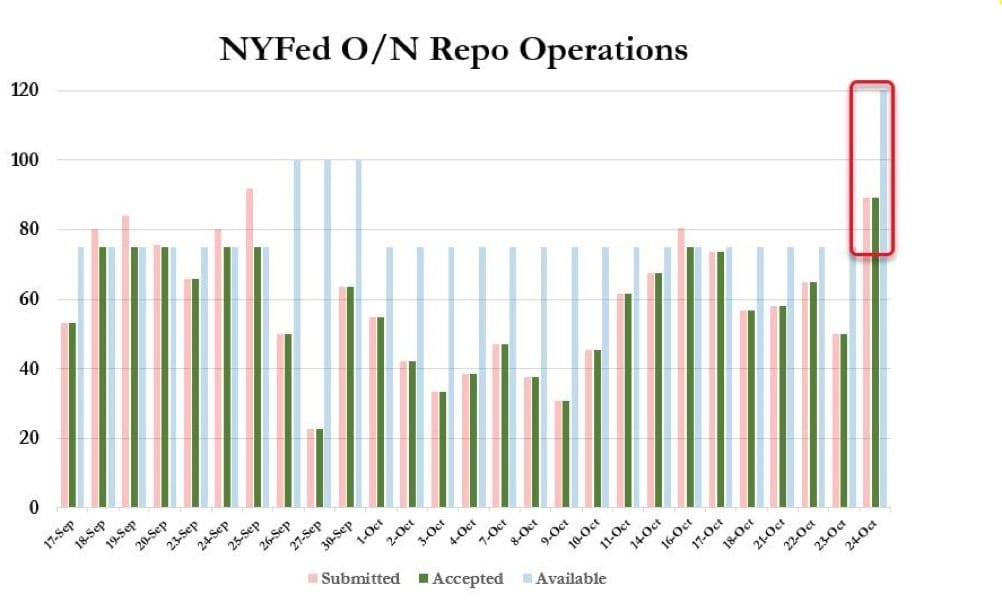
Gold investors took notice and nudged gold back up over $1500.
Well, what about gold stocks? I have been following the S & P TSX Global Gold Index since its inception in late 2000.
Gold stocks need to close above the 280 level on the S & P TSX Global Gold Index, for several weeks, to overcome a key support/resistance level embedded in the chart. Recall that this level represents the final Fibonacci support level for the gold index using the 2008 low and the 2011 high. It also represents the high for gold stocks during the counter trend rally of 2016. Today the gold index closed a bit over 240 on modest daily volume.
Daily volume greater than 75 – 90 million shares is better than average daily volume of around 60 million shares and daily volume greater than 90 million shares reflects increasing institutional interest.
The best trading advice offered by exceptional traders sometimes contains a reference to a passage originally attributed to Jesse Livermore: “There is time to go long, time to go short and time to go fishing.” He followed that up with an observation that “waiting” was the hardest and most profitable aspect of investing.
Since identifying the 280 level back in 2012/2013, I have been patiently (and if truth be known, sometimes quite impatiently!) waiting for gold stocks, via the key 280 level, to get the market recognition necessary to make another spectacular bull run like that of 2001 through 2011.
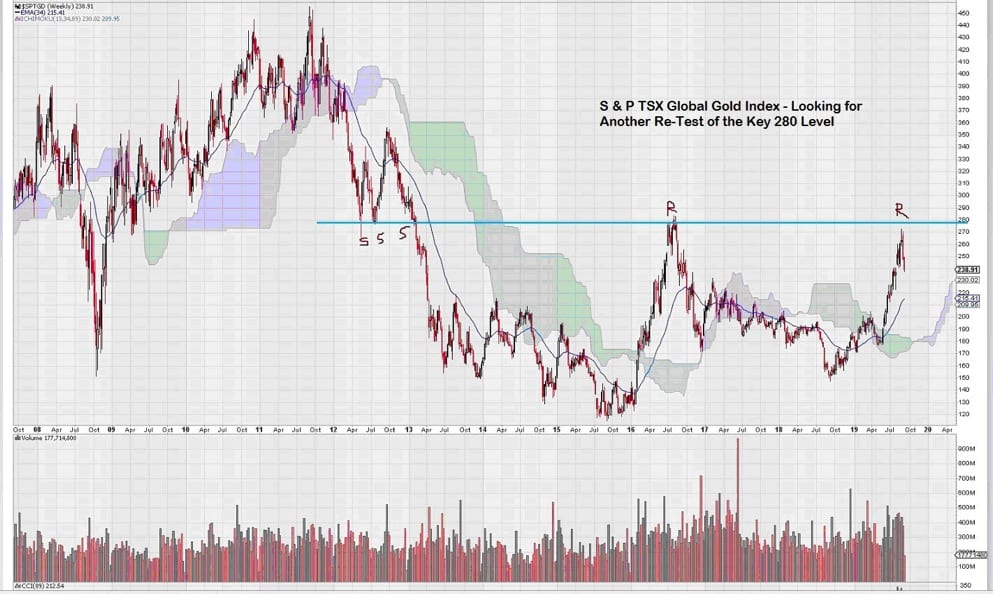
In 2013, the 280 level of the S & P TSX Global Gold Index was breached by obedience to an old traders adage: “Three Taps and Out”. The 280 level has already been tested Twice from below. Is the Third time the charm to break gold stocks out and up and is the long wait nearly over?