


Is the US Dollar Going Higher or Lower?
A look at the USD Chart for November 6, 2019
- John Toporowski
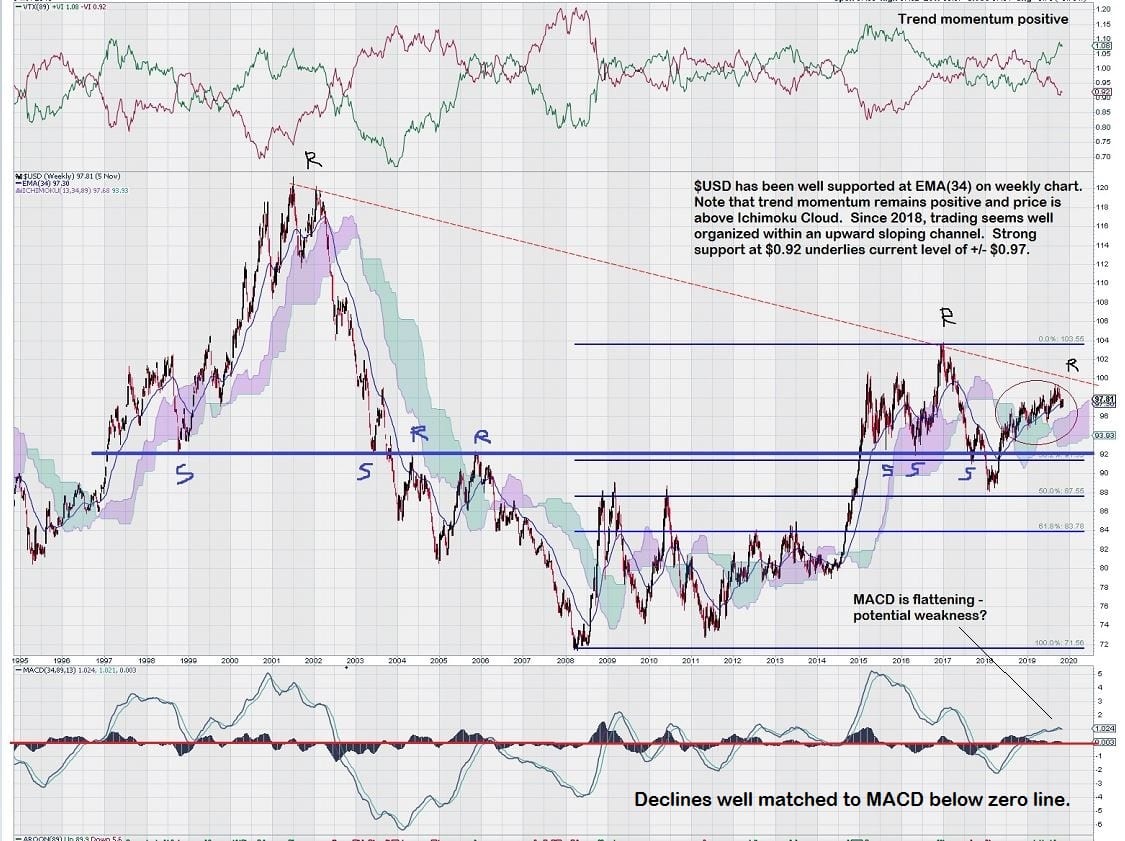
This chart is quite interesting – see period 1997/1998 for MACD (on trend settings).
For the most part the $USD has been “guided” by MACD in this chart.
You can easily see that there are several “peaks and valley” – the $USD is either moving up or moving down – it doesn’t show much side-to-side movement. To me this is indicative of uncertainty or at least hesitancy to continue with its previous directional move.
In 1997/1998, MACD flattened; then weakened as price fell. Note also that trend momentum steadily declined from positive to negative before turning positive again – helping to provide power to a very strong move up. Currently, there is additional risk because MACD is significantly closer to the zero line. This is important because prolonged downtrends trend to take place when MACD is under zero – see period 2002 – 2008.
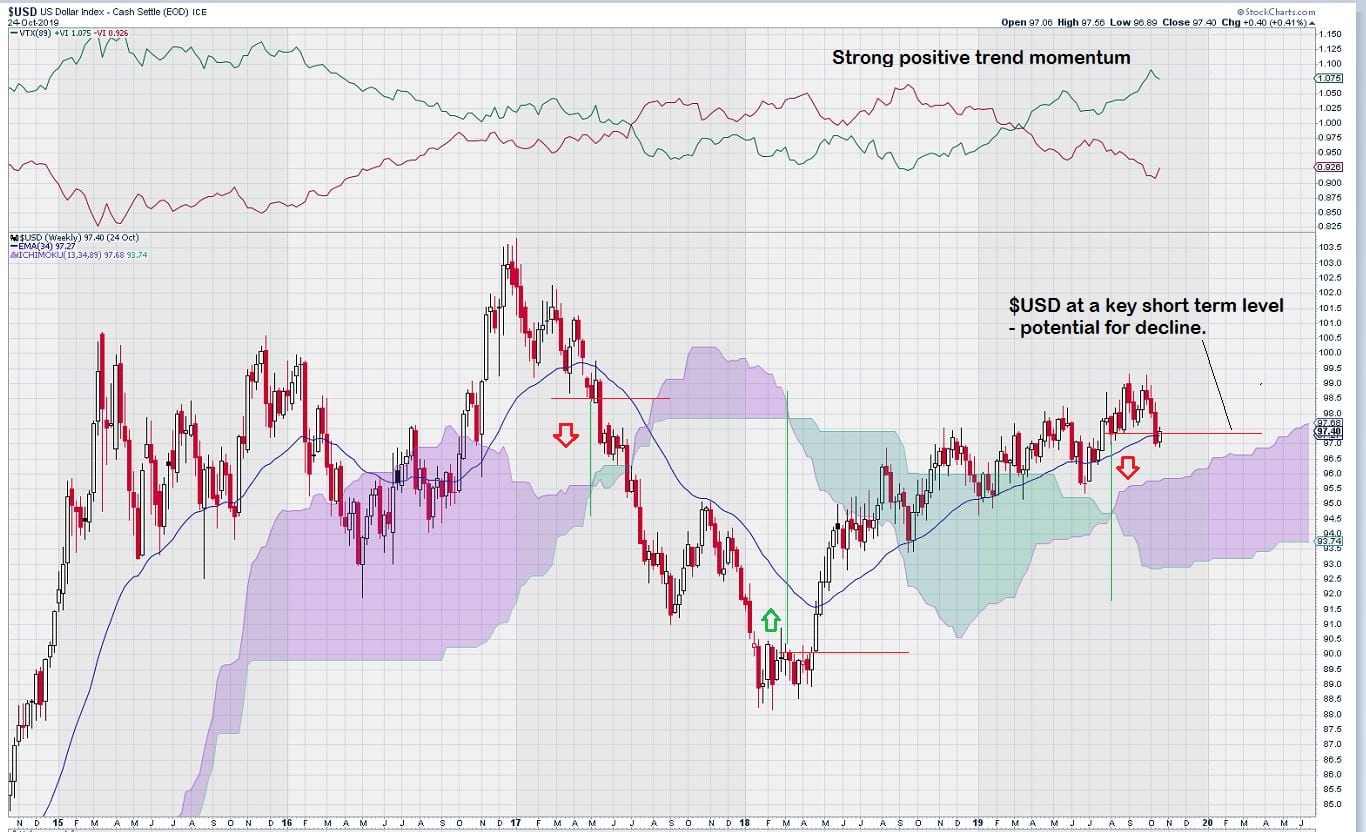
Weakening trend momentum and a decline below the EMA (34) could see the $USD retest its important support level of $0.92.
The $USD remains above the Ichimoku Cloud (simply a graphical way of looking at various moving averages plotted forward in time) and, of course, this is positive.


The chart shows a lateral trend, but I think it will show a downtrend in line with other floating currencies, seeking a trading advantage.
I do not know who is at fault here, but I can not see any articles. I have tried 3 different articles with the same results.
I am using Firefox on mxlinux.
You are not allowing Linux users to view your articles?