A Quick Re-Cap – Educational Segment 002/Copper
Educational Segment 002 – Right on the Money!
A week ago on December 3rd, in our educational segment 002, we took a close look at how a positive MACD crossover of the signal line over the trigger line when both lines were above the zero line was noted for Wallbridge Mining (TSX: WM). This positive chart condition sometimes offers clues for “better things to come”.
Also, we noted that there was speculation that a $42.5 million financing announced on November 29th was primarily underwritten by a big gold miner. One of the clues that this private placement financing was most likely a strategic investor was the very nature of it. This was a “straight” share only financing that did not include warrants or any tax advantaged flow-through benefits.
This turned out to be correct when Wallbridge announced, on December 9th, that Kirkland Lake Gold became a 9.9% shareholder in Wallbridge.
Our original premise was based on our understanding of the dynamics of how junior companies finance themselves during the current period where there has been a significant decline in active investment in the gold sector. In the near future we will closely examine the difference between active and passive investment in gold stocks and what this may mean going forward.
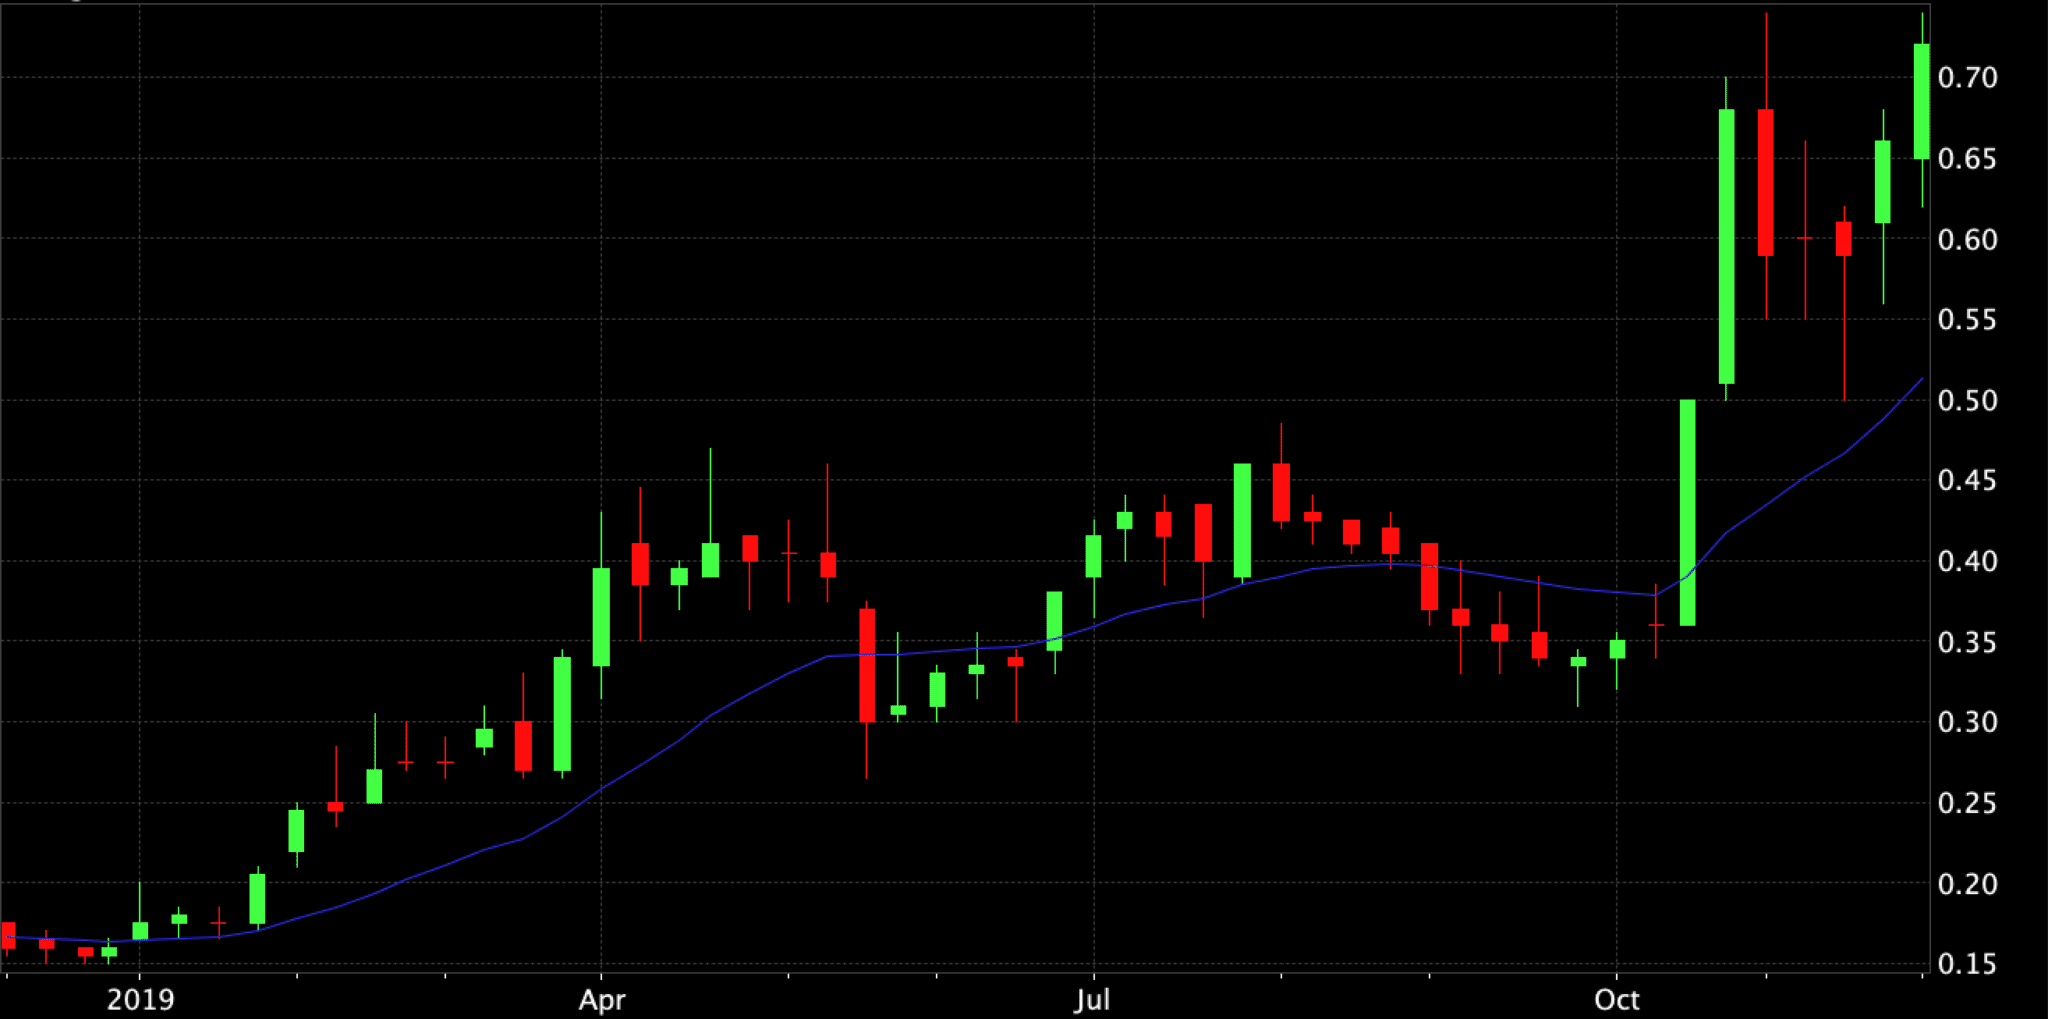
Shares of WM continue to trade well on strong volumes. The MACD signal was generated at $0.50 on the weekly close of October 21st and the subsequent close last week was $0.78. Shares are trading at around this level ($0.80 as this is written) today.
Copper at Near Term Break-out Level
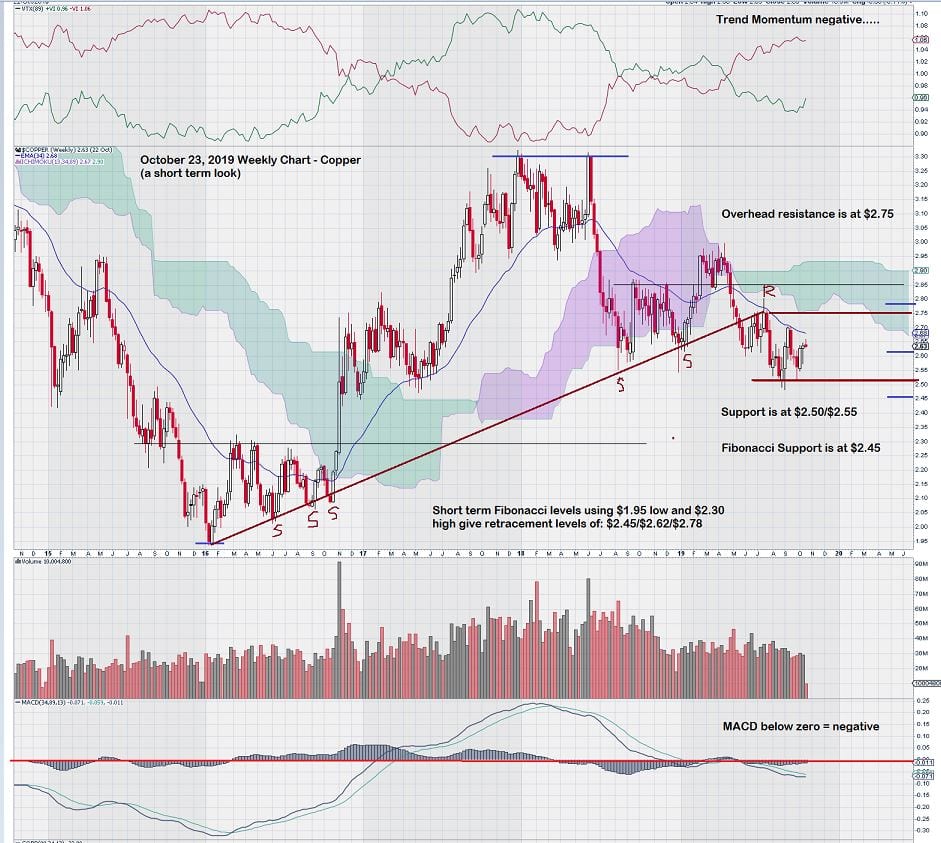
Copper is now trading at $2.75. This level is important because it represents overhead resistance in the weekly chart. (Refer to the weekly copper chart posted on October 23rd.)
Here is that chart again:
It is a widely held view that a resolution of the international trade dispute between China/USA will be price positive for copper and a boost for copper stocks. Today, the long awaited new trade deal between USA/Mexico/Canada is expected to be signed by all three participants. This trade deal, while positive, will not have the same impact as resolving the USA/China trade spat as China remains the largest component of global demand for copper.
As we continue to monitor the copper chart, our immediate positive expectations are somewhat muted by several aspects of the weekly chart for copper.
Firstly, the MACD signal line is just starting to cross over the trigger line but both lines remain under the zero line. The best results for price moves come when both the signal line and the trigger line for MACD are above the zero line. This is not the case….yet.
Secondly, trend momentum (as measured by VTX – the Vortex Indicator – using a longer term trend setting) is still negative but looking better as it is weakening.
Thirdly, a simple power downtrend line drawn from the high of June 2018 through the intermediate high of April 2019 shows a positive crossover based on last week’s close above $2.65.
Lastly, the price chart for copper remains under the Ichimoku Cloud. (refer to October 23 chart above) As noted in the weekly chart, copper rallied from around the $2.50 level in early 2017 to about $3.30 by the end of the same year – once it “broke out and over the cloud”.
**************************************
John Top