
Copper Price Chart – An Eye-Catching Positive Reversal
Recently all eyes have been on gold – and to a lesser extent, silver. So what about copper?
It has been easy to completely dismiss copper in 2020. The shuddering halt to the worldwide economy came as a true “black swan” event that few could have predicted.
Economic hibernation has had an unseen consequence. It has disrupted work routines. It has made philosophers of us all, as we were forced to step back and see how little we actually “had” to consume. In short, for the better part of the year, the collective mindset was on existence, not on consumption. It is for that very reason that copper has disappeared from the radar screen of many resource investors.
Copper took a substantial drop when the decision was made by governments to meet the challenge of the global pandemic head-on by ceasing all activity deemed “non-essential’. In one week, copper declined from $2.50 to around $2.10. Since that decline in March 2020, copper has improved rather steadily, mirroring the belief that science would triumph over fear. Recent positive announcements on the health front are giving investors a reason to reconsider how to make room for copper in their portfolios.
Let’s take a look at the current weekly chart for copper and see if there are any clues worth noting.
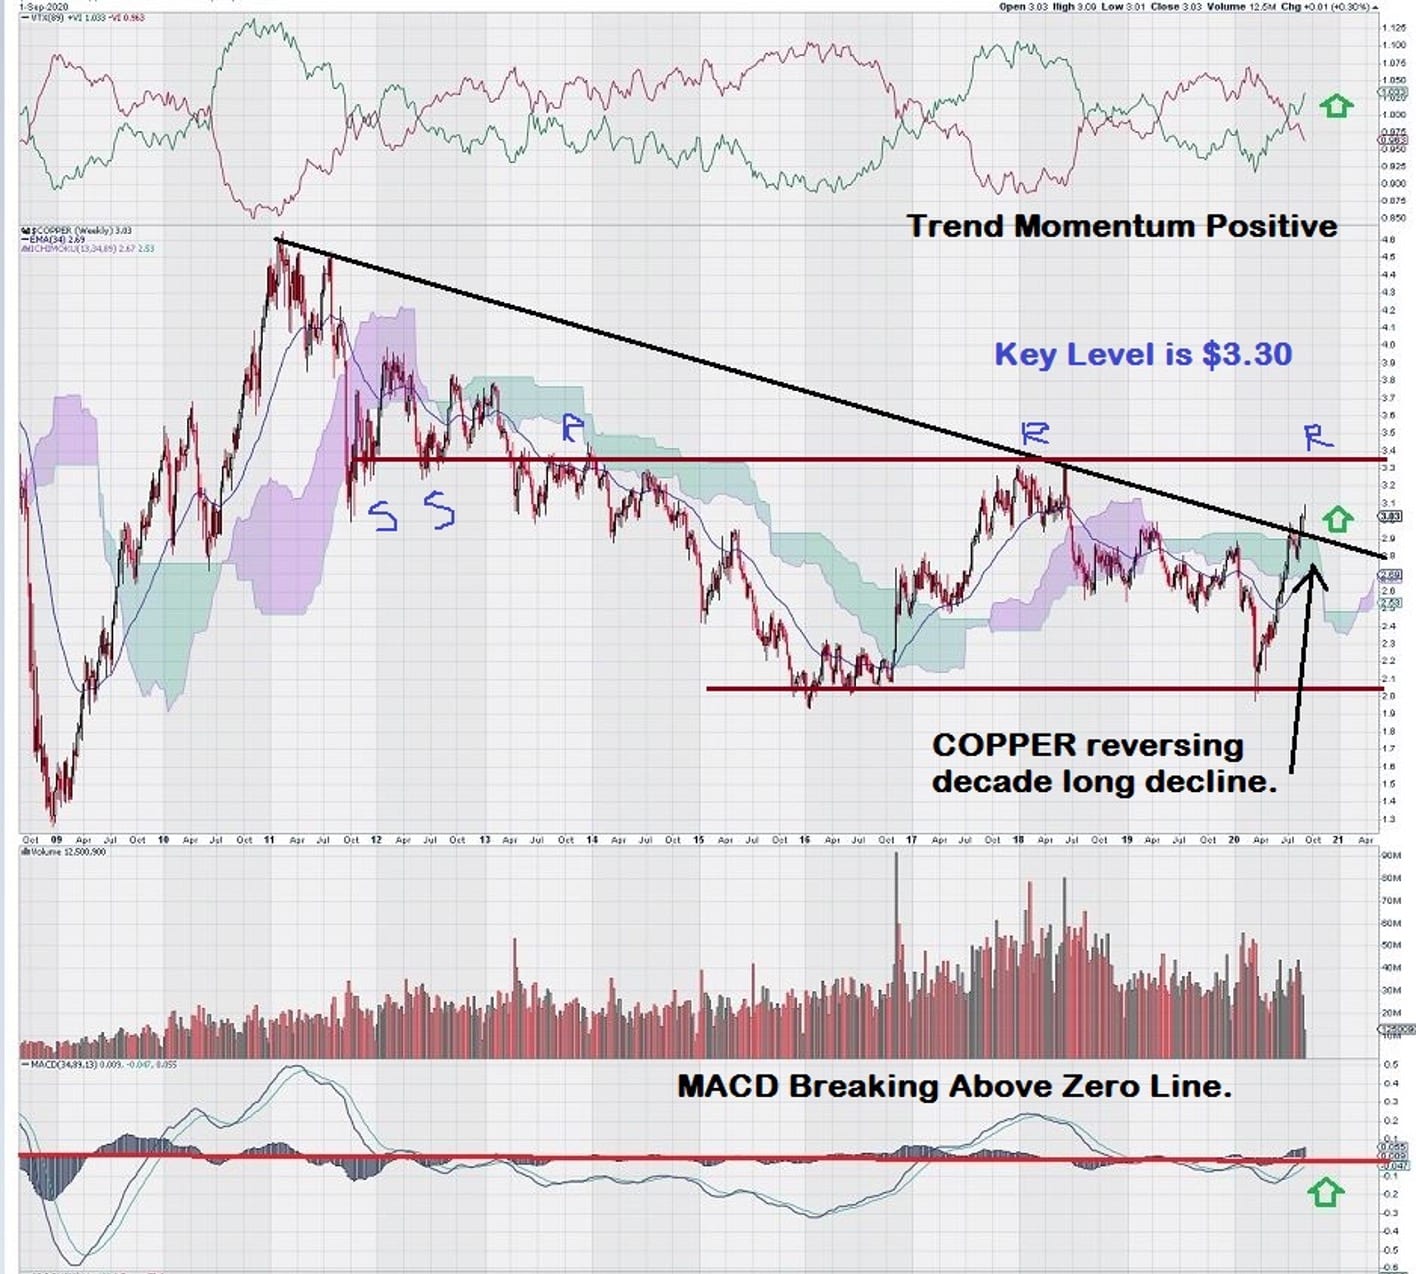
As we can clearly see, copper is reversing a decade-long decline. This reversal is supported by positive trend momentum and long-term “trend” MACD settings that also paint a positive picture as MACD is turning up through the zero line.
For now, the key internal support/resistance level is at the previous interim high of $3.30. Resistance can be expected at $3.30. Many of the regular Equedia readers know that our interpretation of weekly charts is based on “trend settings.” We tend to be “late,” but we tend to identify mostly key levels that are often the turning points for new trends.
An example was our “break out level” for gold of $1350/$1375 that was derived from the weekly chart for gold using standard Fibonacci levels based on the 2008 low and the 2011 high. We also made note of the six-year horizontal resistance at this level.
So what about copper stocks? How have they been performing? Let’s pick a widely followed US copper company, Freeport-McMoran Inc.; FCX – NYSE:
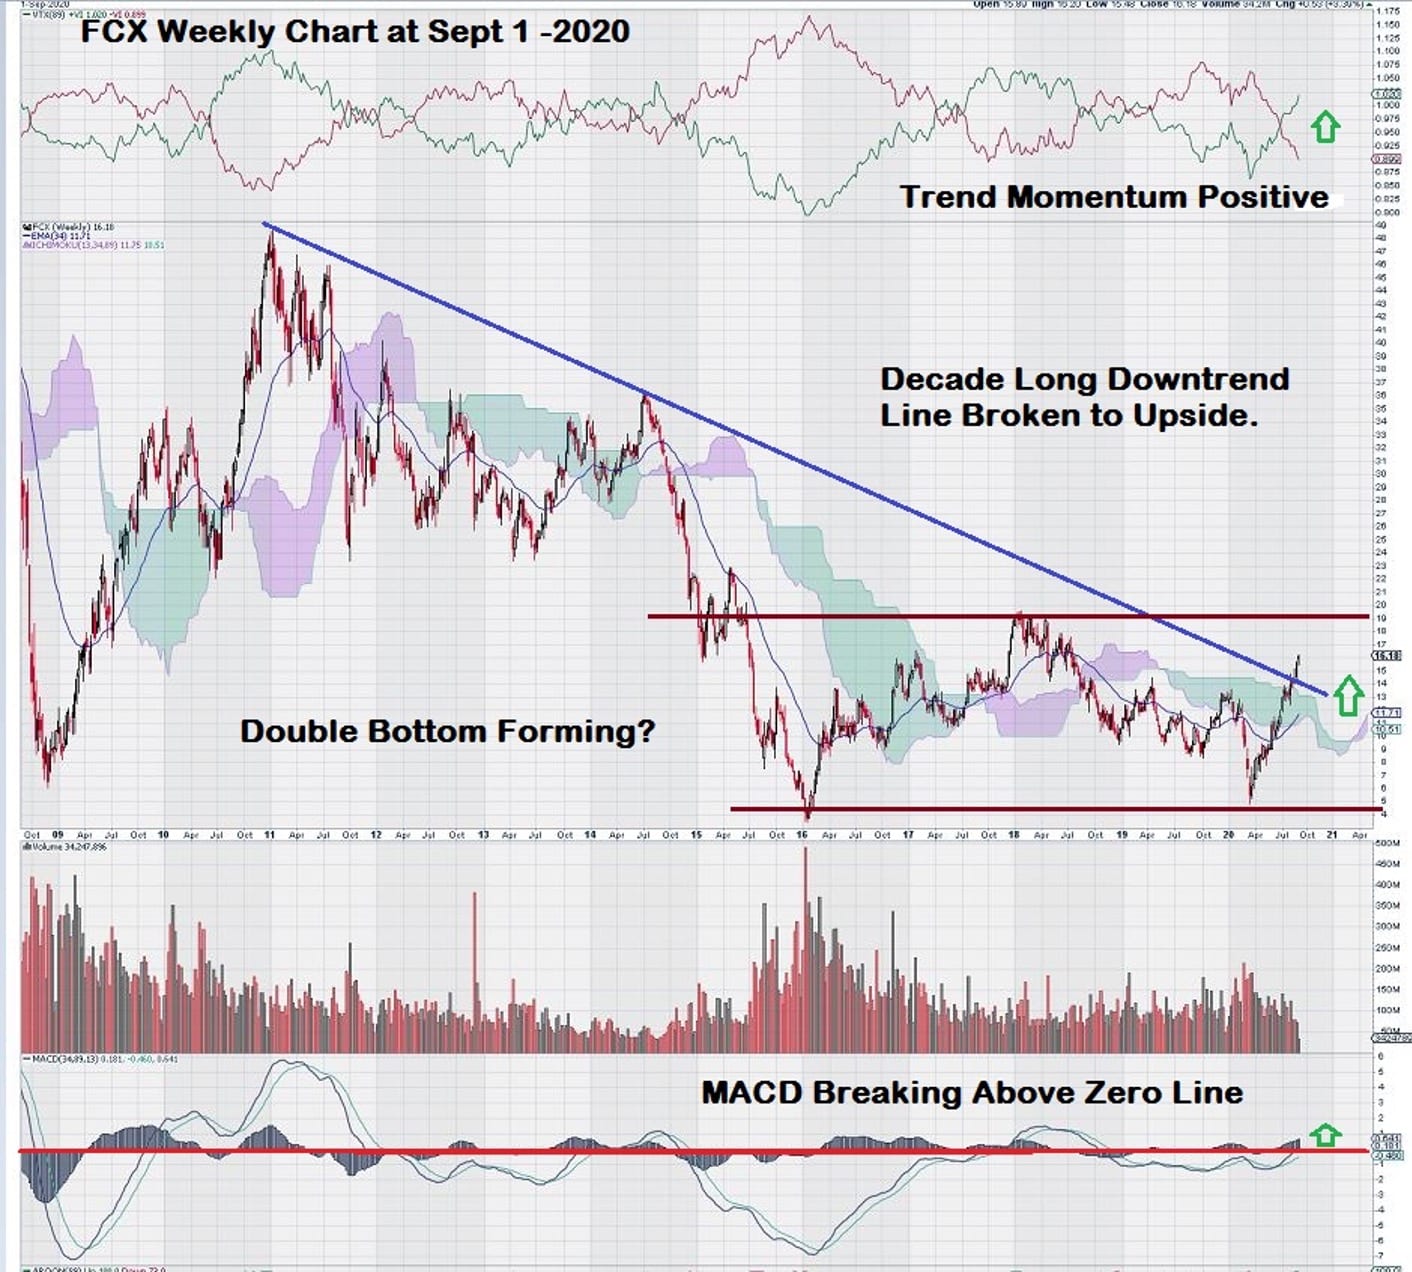
FCX is mirroring the copper chart. It is showing strong technical signs such as positive trend momentum, MACD crossing the zero line, and reversal of a decade long decline noted in the downtrend line.
A double bottom is noted with a break out at around USD $19. The stock is currently trading at USD $16.
Summary & Wrap-Up
The strong price chart for copper may be telling us something else that could spell great news.
Demand is driving price. Demand is a function of future expectations. As it relates directly to copper, these expectations are discounting a “manageable end” to the health concerns brought on by the virus. Otherwise, copper would still be languishing below $3.00 per pound.
The largest consumer of copper is China. Who else could be bidding up the price in advance of a return to global economic growth?
Epilogue
The “China virus” had devastating consequences on the global economies. The lives of much of the world’s population were adversely impacted. Now, it is China who first recognizes that an “end” to the virus is in sight. Copper is strongly reflecting that view by its continued upward climb toward the key $3.30 level.
-John Top, Chart and Technical Trading Expert