
3 Taps and Out – Traders Adage Repeats Again
(Educational Segment 009)
Regular readers of Equedia are by now familiar with a well-worn traders’ adage that we highlighted back in February of this year.
To refresh your memory, take a look at the article that described the stock chart for Ely Gold; (TSXV: ELY and OTCQX: ELYGF).
https://www.equedia.com/traders-adage-a-perfect-example-of-a-three-taps-and-out-chart/
The chart showed a simple ascending triangle with “3 taps,” followed by a break out at around $0.45. It is instructive to note that ELY subsequently traded to the $2.00 level. Today, ELY closed at $1.39.
We suggested that resource investors who like to review charts as a means of initial due diligence, keep this pattern in mind for future charts. This specific chart pattern indicates a long period of price consolidation at a certain level. There is always a very good reason when price moves above this level defined by time.
Here is an observation made in February:
“I bring this particular chart pattern to the attention of our readers because, in the current market environment for gold stocks, it would not be a surprise to see other, similar patterns emerge.”
In keeping with this comment, we are not surprised to see this pattern repeat itself in Kodiak Copper Corp. (TSXV: KDK). Although the pattern isn’t as “clean” as the one for ELY, it is still easily distinguishable.
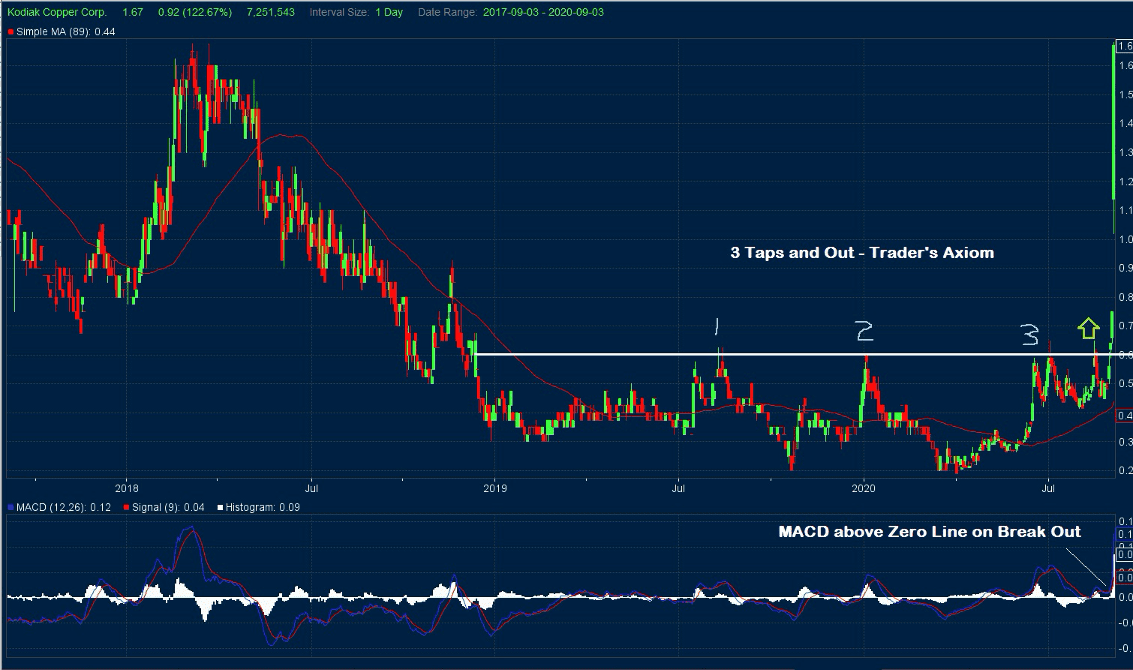
There is a bit of a small “stutter” after the 3rd tap, but then the stock breaks out. Today, we see why. The company announced a strong drill hole in a porphyry gold target in southern British Columbia. The stock had a strong day, gaining $0.92 to close at $1.67.
To be clear, our intention is not to suggest that investors trade the “next best thing” but rather to use this chart as an illustration for educational purposes.
That is why the article is noted in our educational segment. It is to be used as a teaching tool to make you a better trader.
The current market environment supports the formation of this specific type of chart pattern. After a long period of time where exploration funds were not available, there is renewed interest by resource investors to once again “roll the dice”.
In summary, we are now seeing strong management groups use their supplemented treasuries to further explore projects that warranted drilling several years ago but were not explored due to lack of funding interest. Some of these exploration groups will be successful.
They will see instant “re-rating” by the market.
Resource investors who can correctly identify the “Three Taps and Out” chart pattern have a trading advantage. They can use this chart pattern as a means to more closely examine companies to see what fundamentals are about to change, thus resulting in a re-rating.
We hope that the next time you look at a stock chart that you keep this pattern “front of mind.” It could be well worth it…
-John Top, Chart and Technical Trading Expert