The Italian Farmer and the Invisible Rain Cloud
(Chart Educational Segment 004)
A friend of mine told me a story about when he was a young boy growing up in Italy. He was going out into the fields to help his uncle, a farmer.
Upon leaving his uncle’s house, he heard these words: “You had better go back inside and get a hat and a coat – it’s going to rain later today.” My friend looked up into the cloudless sky and said to his uncle, “No, it’s not going to rain; I’ll be ok.” His uncle said nothing but simply smiled to himself.
Later that day, when the clouds rolled in, and the rain began, he was cold. He remembered what his uncle had said earlier. How did his wise old uncle know what was going to happen?
This is how we should treat certain “Traders Adages.” A trader’s adage is something that has proved itself over and over again.
Some younger traders, like the boy in the story, choose to ignore these adages. But, other more seasoned traders, are like the uncle – they have enough experience to pay attention when the “charts” are speaking….
So today, I was having my morning coffee with a fishing buddy who mentioned a gold royalty company that he had invested in. Naturally, upon returning home, I took a look at its chart. The chart is a “picture perfect” example of a very well used Traders Adage: “3 Taps and Out”.
Let’s have a look and see if there is a lesson to be learned…
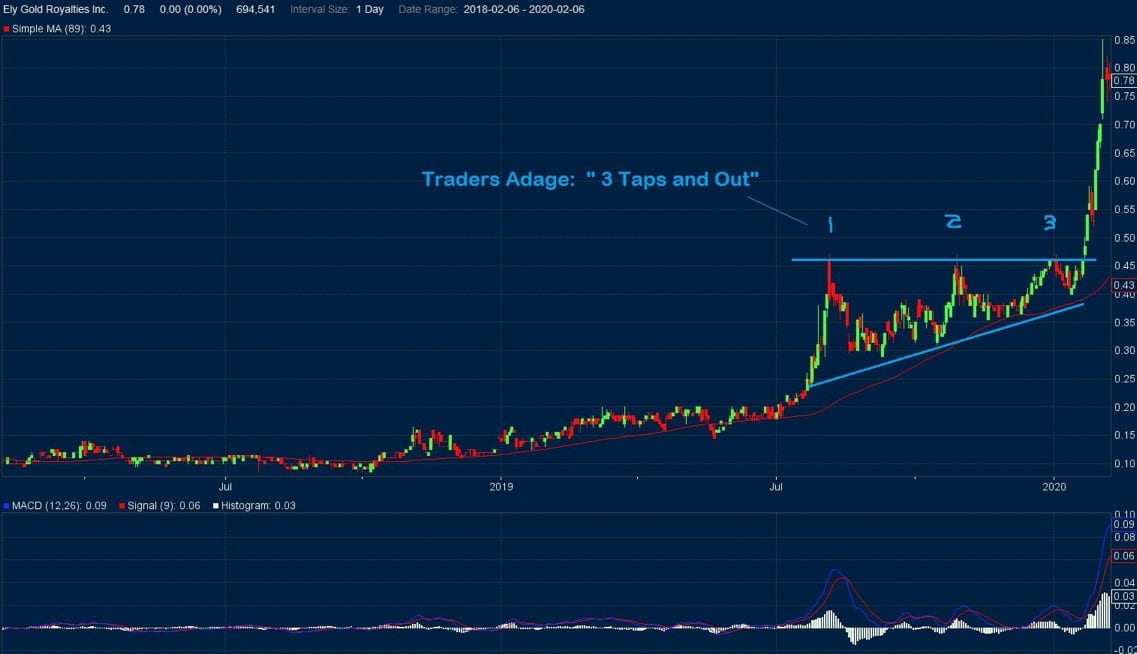
The chart for ELY-V; OTQB:ELYGF shows a tradeable chart pattern: the ascending triangle with a breakout. It also highlights the “3 Taps and Out” traders adage.
I bring this particular chart pattern to the attention of our readers because, in the current market environment for gold stocks, it would not be a surprise to see other, similar patterns emerge. After all, the gold industry has managed to endure through a very difficult period since the top in 2011.
Now we are starting to see the better companies, like the one noted above, complete their consolidation patterns on daily and weekly charts. When these patterns show a break out to the upside, accompanied by a marked increase in volume, then it is probably a good time to pay close attention to the charts.
Charts don’t often “talk,” and when they do, we have a choice: to listen carefully or ignore completely…..are we the boy or the uncle?
– John Top