


Dear Readers,
If you’re the “smart money”, you’ve already begun to accumulate.
If you haven’t, you’re probably like most average investors – you buy too late and sell too early.
In fact, what’s happening right now is a perfect example of this mentality.
You see, last year, we witnessed gold climb nearly 20% – fuelled by the second highest annual total in 50 years of central bank purchases.
Central banks weren’t the only smart money buying. Inflows into gold-backed ETFs hit a record year-end total in 2019.
Yet, household demand for gold dropped to a level not seen in a decade.
Perhaps it was the rise in price that prevented the average person from buying more gold; or perhaps, once again, the smart money is coming in first.
Either way, what we are witnessing could very well be the beginning of a long bull market for gold and gold stocks.
You see, had it not been for the 11% jump in the recycling of gold last year, gold supplies would have dropped significantly, as annual mine production dropped for the first time in 10 years.
Now, I could tell you all of the reasons why gold is looking to have another breakout year, but I think you already know many of those reasons.
Which is why today, I am going to let a much more conservative investor tell you why gold equities may finally be headed in the right direction, using charts as a baseline.
The last time he told me to follow his charts, he was bang on.
You should hear what he has to say today…
-Ivan Lo
Waiting for the (Golden) Miracle to Come
One of Canada’s legendary poet/songwriters, Leonard Cohen, has a catchy tune entitled, “Waiting for the Miracle to Come.” The song contains a powerful message in one simple line:
“Yeah, I waited half my life away.”
These days, when I take stock of the way that the gold sector continues to perform, in entirety, not just by way of a specific equity, that is how it sometimes seems to me.
Let me explain.
At the end of 1999 and going into 2000, I got introduced to the idea of learning more about technical analysis by Jim Sinclair.
Through luck and circumstance, Jim took over the management of a Tanzanian gold exploration company that I was working for at that time. His interest in the application of technical analysis to various markets intrigued me, and being curious by nature, I took his advice and started what has turned out to be a life-long “self-study course.” Jim was always there to answer questions and provide guidance, for which I will always be appreciative.
Moving along…
Years later, this new-found knowledge was put to the test when the commodity markets “got good” due to the China Super Cycle for Metals.
The timing could not have been better.
(See Educational Segment 003 – The Footprint of an Elephant – Not the Footprint of a Mouse!)
I must admit that there is no feeling quite like the application of new-found knowledge to achieve a goal. All of us who have played sports remember that time when “it worked.” Whether it was that first homerun over the fence or that last-second shot that swished through the twine, the overwhelming sense of accomplishment is unmistakable.
That brings us to the early part of 2013.
By that time, I was charting the S & P TSX Global Gold Index regularly. Also, I had developed a very healthy respect for Fibonacci Retracement Levels, having seen numerous charts “obey” these levels, time and time again.
The TSX Weekly Gold Chart was a flashing red light of extreme caution in early 2013. As noted before, the 280-level of the index represented the final Fibonacci Retracement level derived from the 2008-low and the 2011-high. The old trader’s adage of “three taps and out” was also a strong consideration at the 280 level.
Recognition of these factors led me to reduce some of my gold equity holdings significantly. In the same manner that a pilot learns to “trust” instruments over anything else; I came to put my faith and trust in “the charts.”
So what happened?
The gold index gave way at 280, and a few months later, in April, the gold market was “shocked into submission” with a highly unusual sale.
This from www.zerohedge.com
Via Ross Norman of Sharps Pixley:
“The gold futures markets opened in New York on Friday 12th April to a monumental 3.4 million ounces (100 tonnes) of gold selling of the June futures contract in what proved to be only an opening shot. The selling took gold to the technically very important level of $1540, which was not only the low of 2012; it was also seen by many as the level which confirmed the ongoing Bull Run, which dates back to 2000. In many traders’ minds, it stood as a formidable support level – the line in the sand.
Two hours later, the initial selling rumoured to have been routed through Merrill Lynch’s floor team, by a rather more significant blast when the floor was hit by a further 10 million ounces of selling (300 tonnes) over the following 30 minutes of trading. This was clearly not a case of disappointed longs leaving the market – it had the hallmarks of a concerted ‘short sale’, which by driving prices sharply lower in a display of ‘shock & awe’ – would seek to gain further momentum by prompting others to also sell as their positions as they hit their maximum acceptable losses or so-called ‘stopped-out’ in market parlance – probably hidden the unimpeachable (?) $1540 level.
The selling was timed for optimal impact with New York at its most liquid, while key overseas gold markets including London were open and able feel the impact. The estimated 400 tonne of gold futures selling in total equates to 15% of annual gold mine production – too much for the market to readily absorb, especially with sentiment weak following gold’s non performance in the wake of Japanese QE, a nuclear threat from North Korea and weakening US economic data. The assault to the short side was essentially saying “you are long… and wrong”.
So here we are, almost a full seven years later, with the gold index looking to test the 280 level for the third time, but this time from below.
Is it time, once again, to place the same “faith and trust” in the “the charts?
Yes, it is. And, although not yet confirmed, it is looking more and more like the long wait may finally be over.
Take a look:
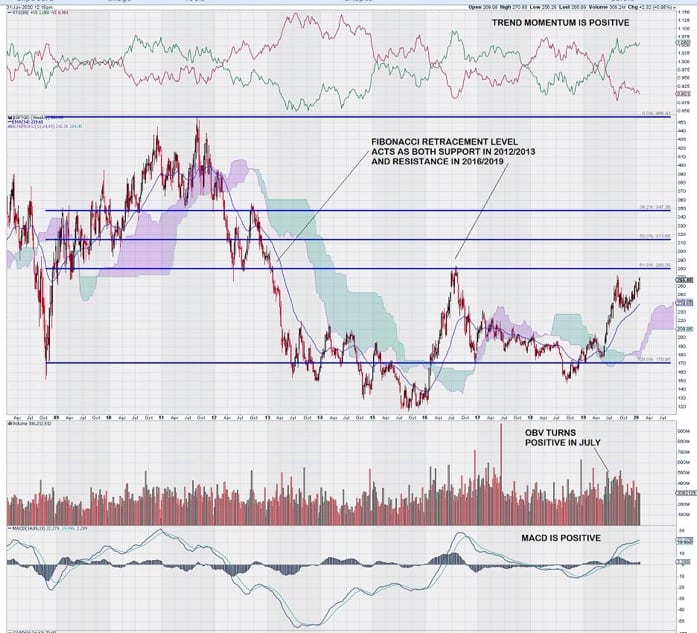
I don’t need much convincing, provided that the gold index does indeed break through the key 280-level. Several positive chart indications are already in place. Trend momentum remains positive. MACD, on long-term trend settings, is positive and above the zero-line. OBV is positive and expanding upwards. In summary, all the technical indicators are “in the right spot.” Now it is up to the market to decide.
My primary focus at this time is on volume – I would like to see some 100 million-plus share volume days to help confirm a breakout above the key 280-level.
It is worth remembering that the trading action in gold and gold equities is taking place at a time when the $USD is moderately strong. See last week’s post: “What to Expect from the US Dollar in 2020 and Beyond“ for a closer look at how the $USD has been grinding upwards since 2011 – when gold and gold stocks peaked.
Despite a stronger and improving gold price, investors in gold stocks remain skittish, and we have not seen their “real” commitment yet. However, as the chart plainly shows, a line in the sand has been drawn. Will 2020 be remembered as the “Crossing of the Rubicon” when it comes to gold stocks?
We are all aware that several billionaire mining magnates have already made their bets on gold and gold stocks. The chances are that they have been looking at the same chart we are – perhaps even with the same conclusion.
Timing is everything…
-John Top


Gold is liked by people like CBN Pat Robertson I think he said years ago maybe i think so
The chart for $GOLD today has it at $1588, but your chart is much lower, like about $1350. Why is that?
No inflation & strong dollar equal weak gold. The recent blip up in Gold should be shorted, the bulk of commercial investors are short gold, & silver. Platinum oversupply for years, and even more production this year.. I’d short all the metals except palladium.
I enjoy reading your investment newsletter, lots of good information, gold seems to be highlighted as a potential investment that could grow in the coming months, as worldwide events does point to some financial difficulties that could cause losses in the stock market, not to mention, a decline in investor sentiment. Any suggestions on what gold stocks would be a good buy to hold, and mining stocks too. I realize that Equedia does not provide investment advice and you are not brokers or financial institutions. Any words of wisdom from the Equedia pro’s would be helpful and appreciated. Thank you!
I am so sick of all of you as an investor i am confused what to do next because everyone is saying something different no one knows for sure it is all speculation.
there is very little understanding of how much fiat currency is increase the cost (opportunity cost) of everything. these chickens will come home to roost . .. not sure if in m lifetime, but fairly confident that during my kids lifetimes
Again, are you a pump’n’dumper? How come you don’t tell us when and what you’re SELLING?
Golden miracle already in play, adding it to central vaults tends to increase returns as well for those hedged in that direction.
Chinese economy looking to catch up to North America later in the year, construction trends tend to be very positive.
For those looking for ultra conservative and stable returns, recommending a 50% dividend payer strategy – anything less would be ludacris with the before mentioned goal in mind.
Thanks Equedia for your fantastic knowledge and sharing.
Highly looking forward to another excellent year for capital markets, and money in general. .
What’s up it’s me, I am also visiting this web site daily, this site is really fastidious and the visitors are really sharing good thoughts.