
TSX Gold Index Breaking the Golden Trail for GDXJ
We have noted a similar chart pattern starting to emerge for the GDXJ that compares favorably to the one seen for the S & P TSX Global Gold Index (TSX Gold Index). Let’s review these two charts and see if there is a trade coming our way…
First, we take a look back at the TSX Gold Index weekly chart that we highlighted in our Educational Segment (005) entitled, “Worth The Golden Wait, As Easy as 1-2-3 When You Use Long Term M-A-C-D.“
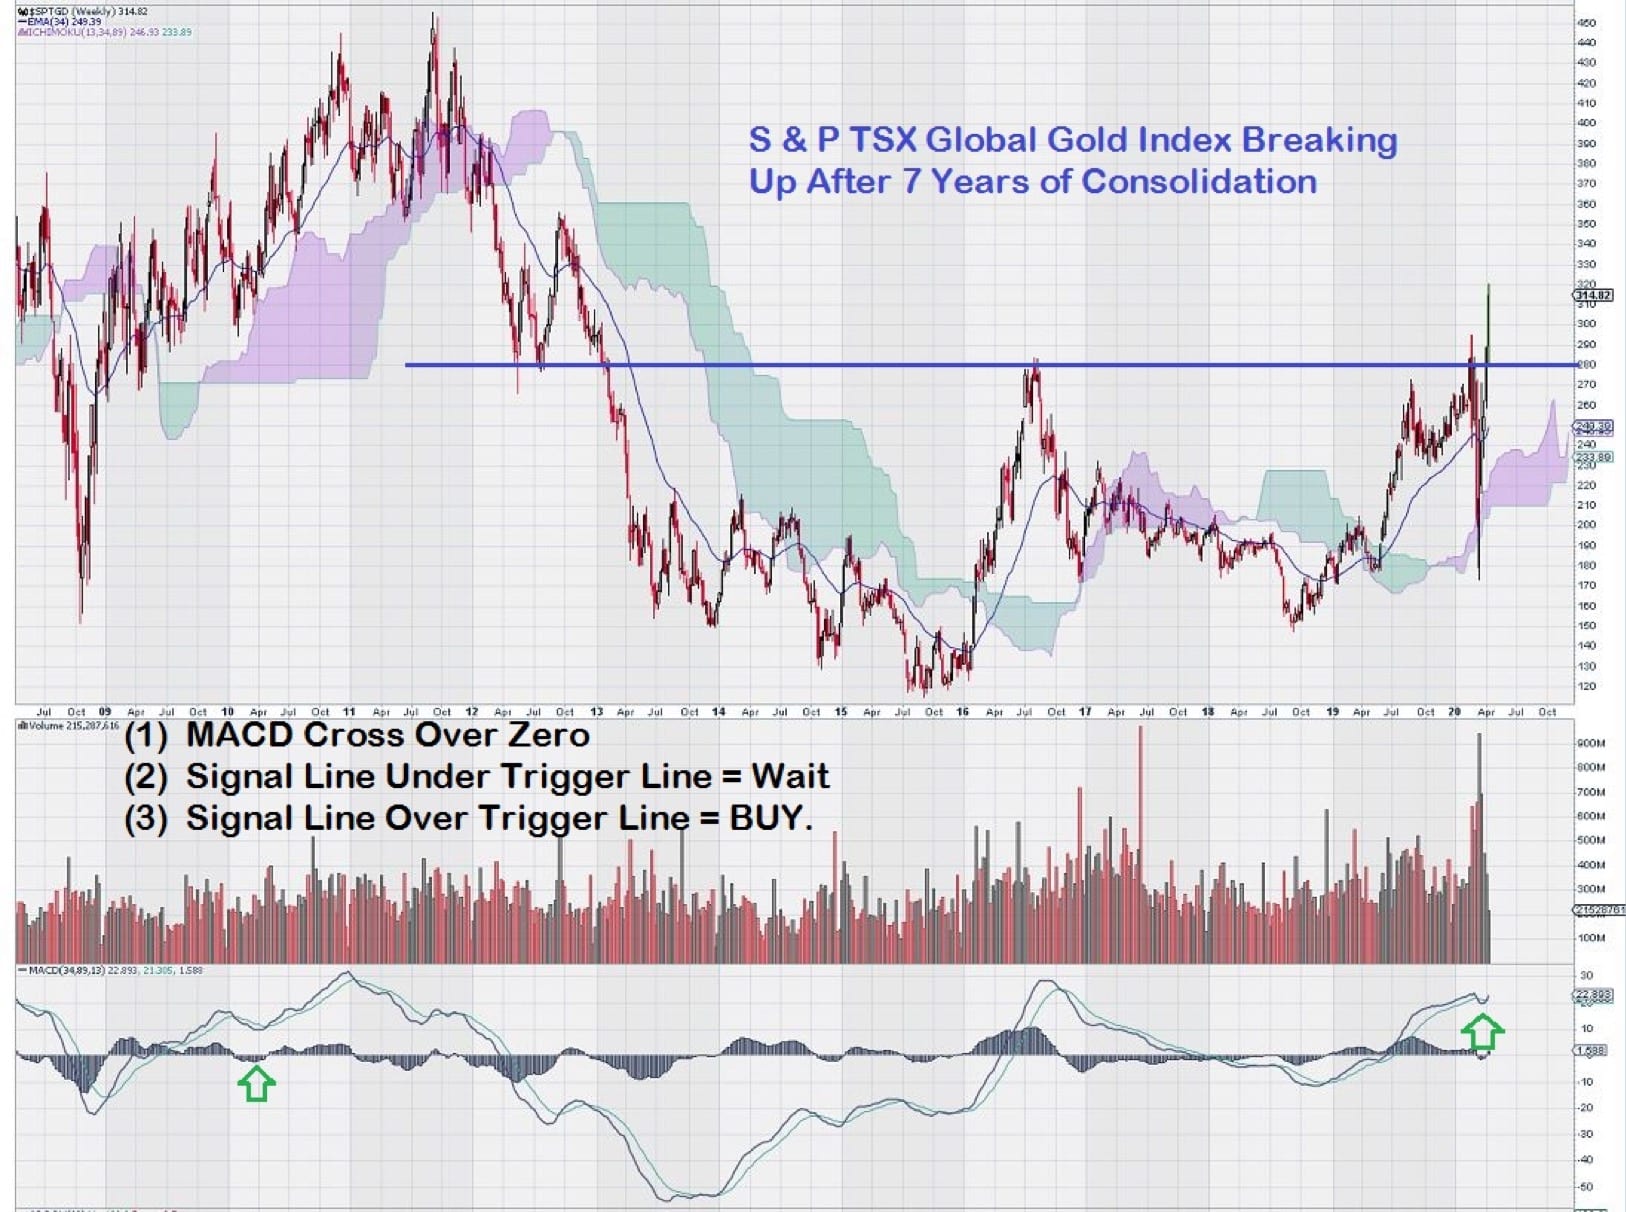
So what happened between April 15th and today? The TSX Gold Index performed well as expected with the completion of the MACD Crossover Above the Zero Line. This is highlighted on the chart by the Green Arrow at the right-hand side.
Upon closing above the key 280 level (the horizontal blue line on the chart) and supported by the positive MACD crossover, the TSX Gold Index continued its upward trajectory.
Today, in the middle of the trading session, the TSX Gold Index is trading above 370, a gain of nearly 100 points.
OK, so this chart analysis and subsequent strong performance have certainly got our attention. Now what?
Now we take a look at the broadly held and very liquid GDXJ ETF.
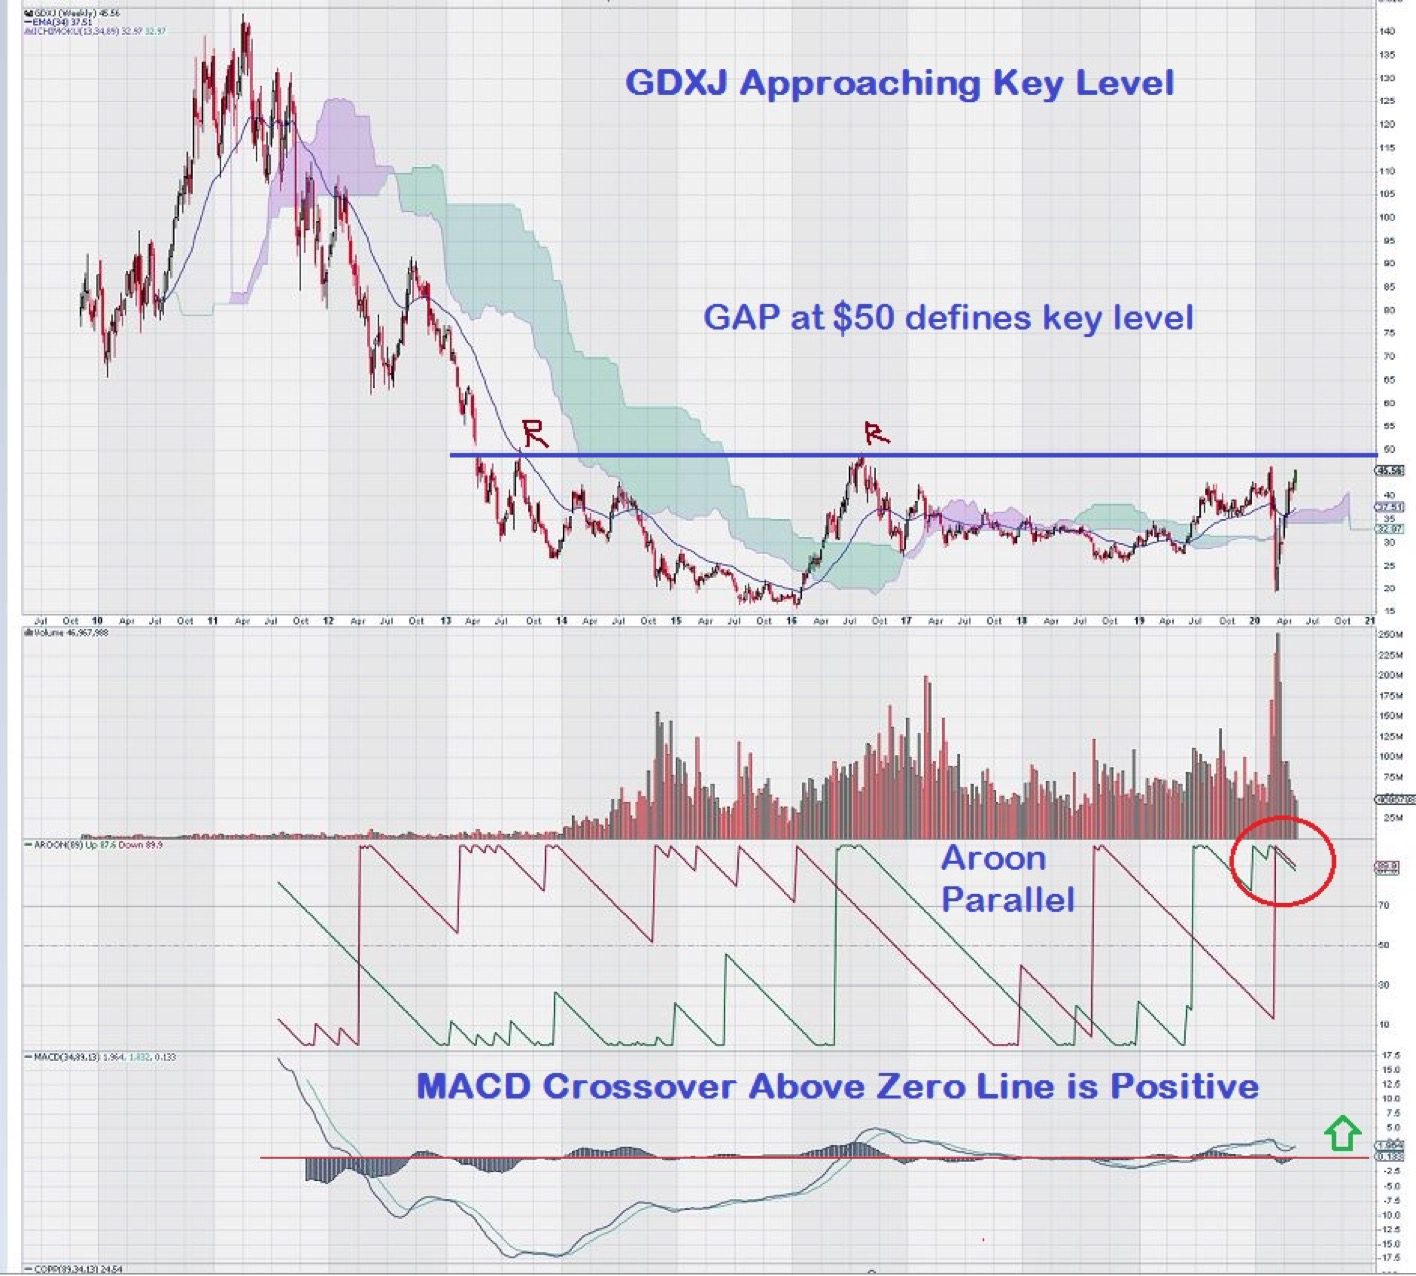
Once again, we see a key level ($50) that is well defined by a prominent gap formed back in 2013 when both gold and gold stocks fell sharply. (Recall that 10 million ounces of gold were sold in an effort to destroy the price.)
More detail is provided in this link:
https://www.marketwatch.com/story/gold-falls-sharply-copper-hit-after-china-data-2013-04-15
In 2016, the GDXJ rallied back to the key level of $50, as defined by the trading gap.
One trading axiom is: “Gaps on the way Down provide Resistance on the way Up.”
This “trader’s tip” proved to be correct as the $50 level provided strong enough resistance to turn back the short-lived bullish sentiment around gold and gold stocks in 2016.
It should be noted that the TSX Gold Index also failed to advance past its key level of 280 in 2016.
The positive MACD crossover above the zero line is telling us to keep a close eye on the $50 level in the weeks ahead. A close above this key level, followed by successive closes above it with “better” candlesticks, and strong volume will be confirmation that there is “blue sky ahead” for the GDXJ to advance.
We have also highlighted Aroon, an infrequently used indicator named for a Sanskrit word that translates to “Dawn’s Early Light.”
Aroon is closely parallel, an indication that consolidation is still underway.
More detail about the Aroon Indicator can be found in this link:
https://school.stockcharts.com/doku.php?id=technical_indicators:aroon
See the section entitled “Consolidation Period.”
Summary
Long term weekly charts that are set up to use Fibonacci Numbers in various settings have been shown to give reliable trade signals. These long term charts offer another “bonus” to investors – the “luxury of time.”
Change does not occur quickly on these charts. This means that investors can track them to see if breakouts occur at key levels. There is lots of time to develop a selection method that suits the risk profile of each individual investor.
Although the GDXJ has yet to crossover the key $50 level, it is worth setting a trading alert on your trading program to make sure that when it does, you can focus on the key “2nd-week confirmation” trading concept discussed in our previous article, “2nd Week Confirmation – Failure is Not an Option”.
-John Top