
An Example of a Winning Trade
Regular readers of the EQUEDIA chart educational segments are well aware of an essential technical requirement necessary to evaluate charts properly.
That requirement is what we like to refer to as “2nd-week confirmation”. Usually, this means what happens on the 2nd weekly close after a signal line is crossed. Our preferred time reference in regard to charting is one-week intervals.
The signal line might be an internal support/Rresistance level, an EMA (exponential moving average), or the key level defined by a particular chart pattern. Think about common patterns: head and shoulders/cup and handle/simple box range, etc.
So today, we will take a very close look at a small gold stock, WM.TO. In particular, our focus is on how the stock behaves after it fails to find support at the key long term internal support/resistance of $0.60. Recall that we originally featured this Company as a trade last year in December.
Let’s start by taking a long look at WM.TO.
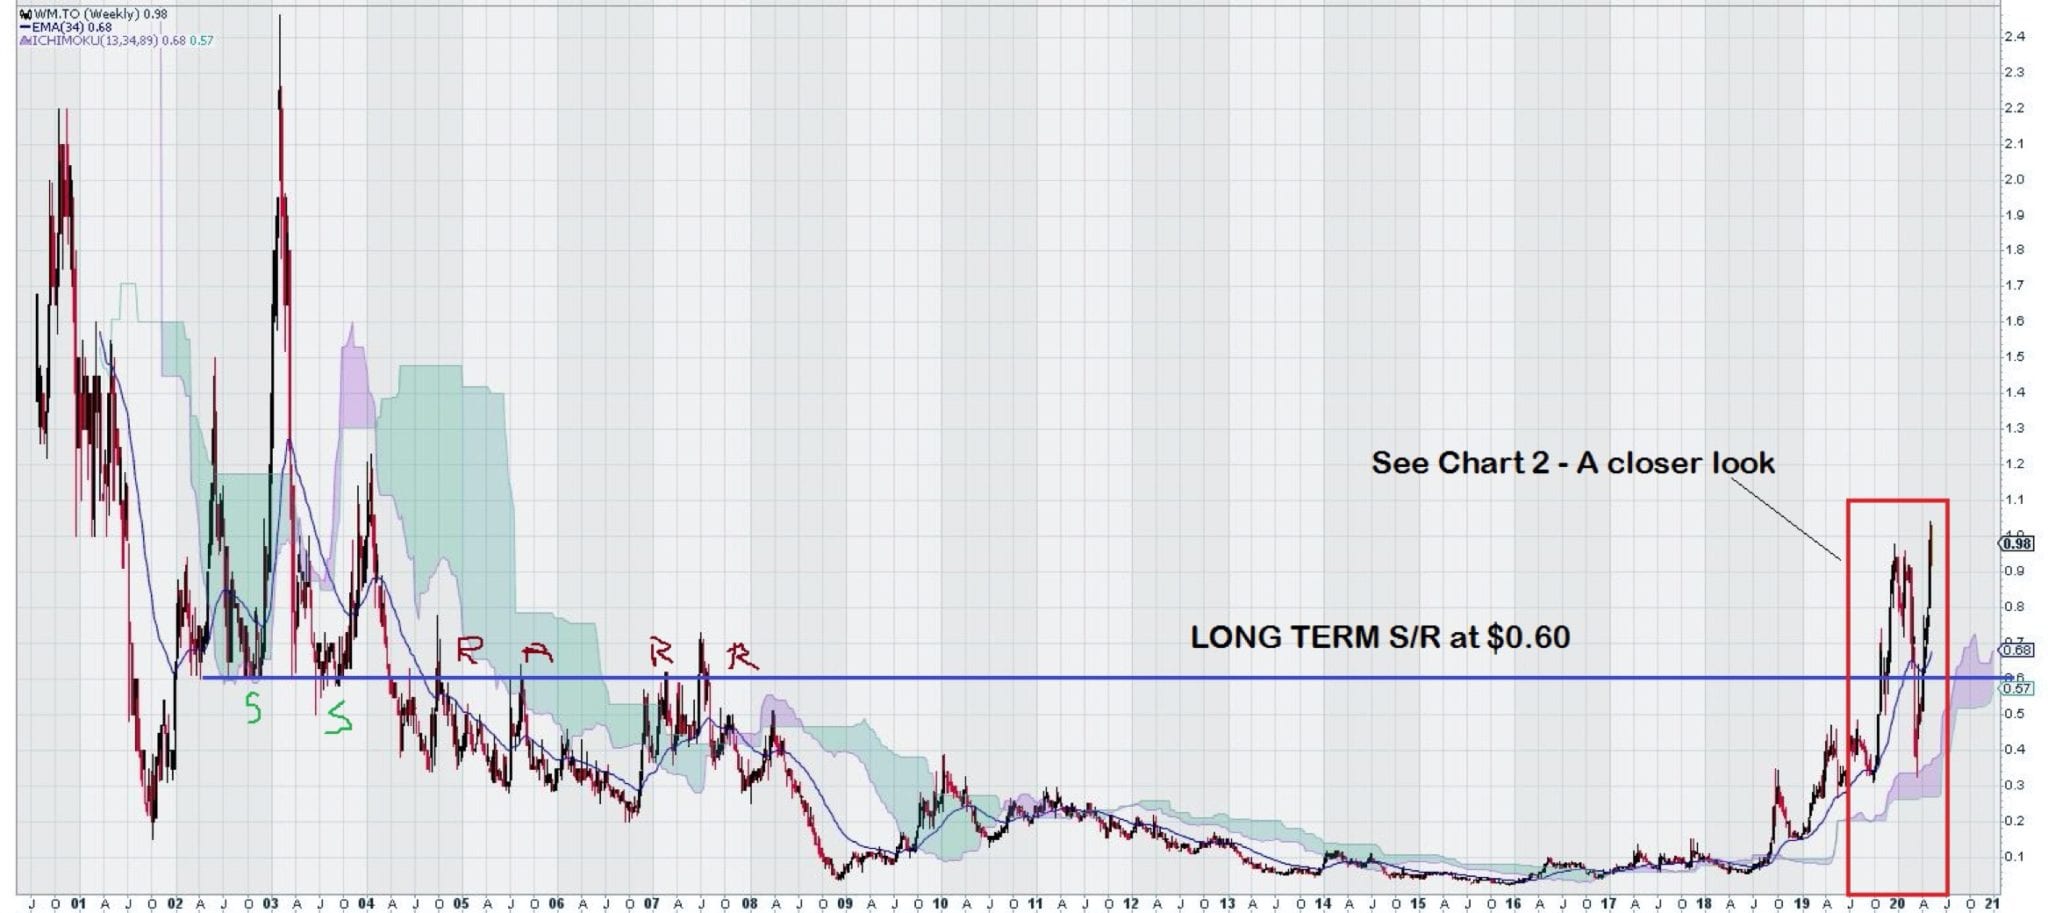
Here we see a well defined internal and horizontal level of Support/Resistance at the $0.60 level. We will take a closer look at how the stock traded at and through this level recently.
In our closer look, we can see what happens when the $0.60 level is crossed to the downside and, most importantly, what kind of candlestick is formed in the second week. This is what we are most interested in because we are looking for confirmation of the move lower with a stronger red candle, preferably with additional downside volume. Did this occur? Let’s see…
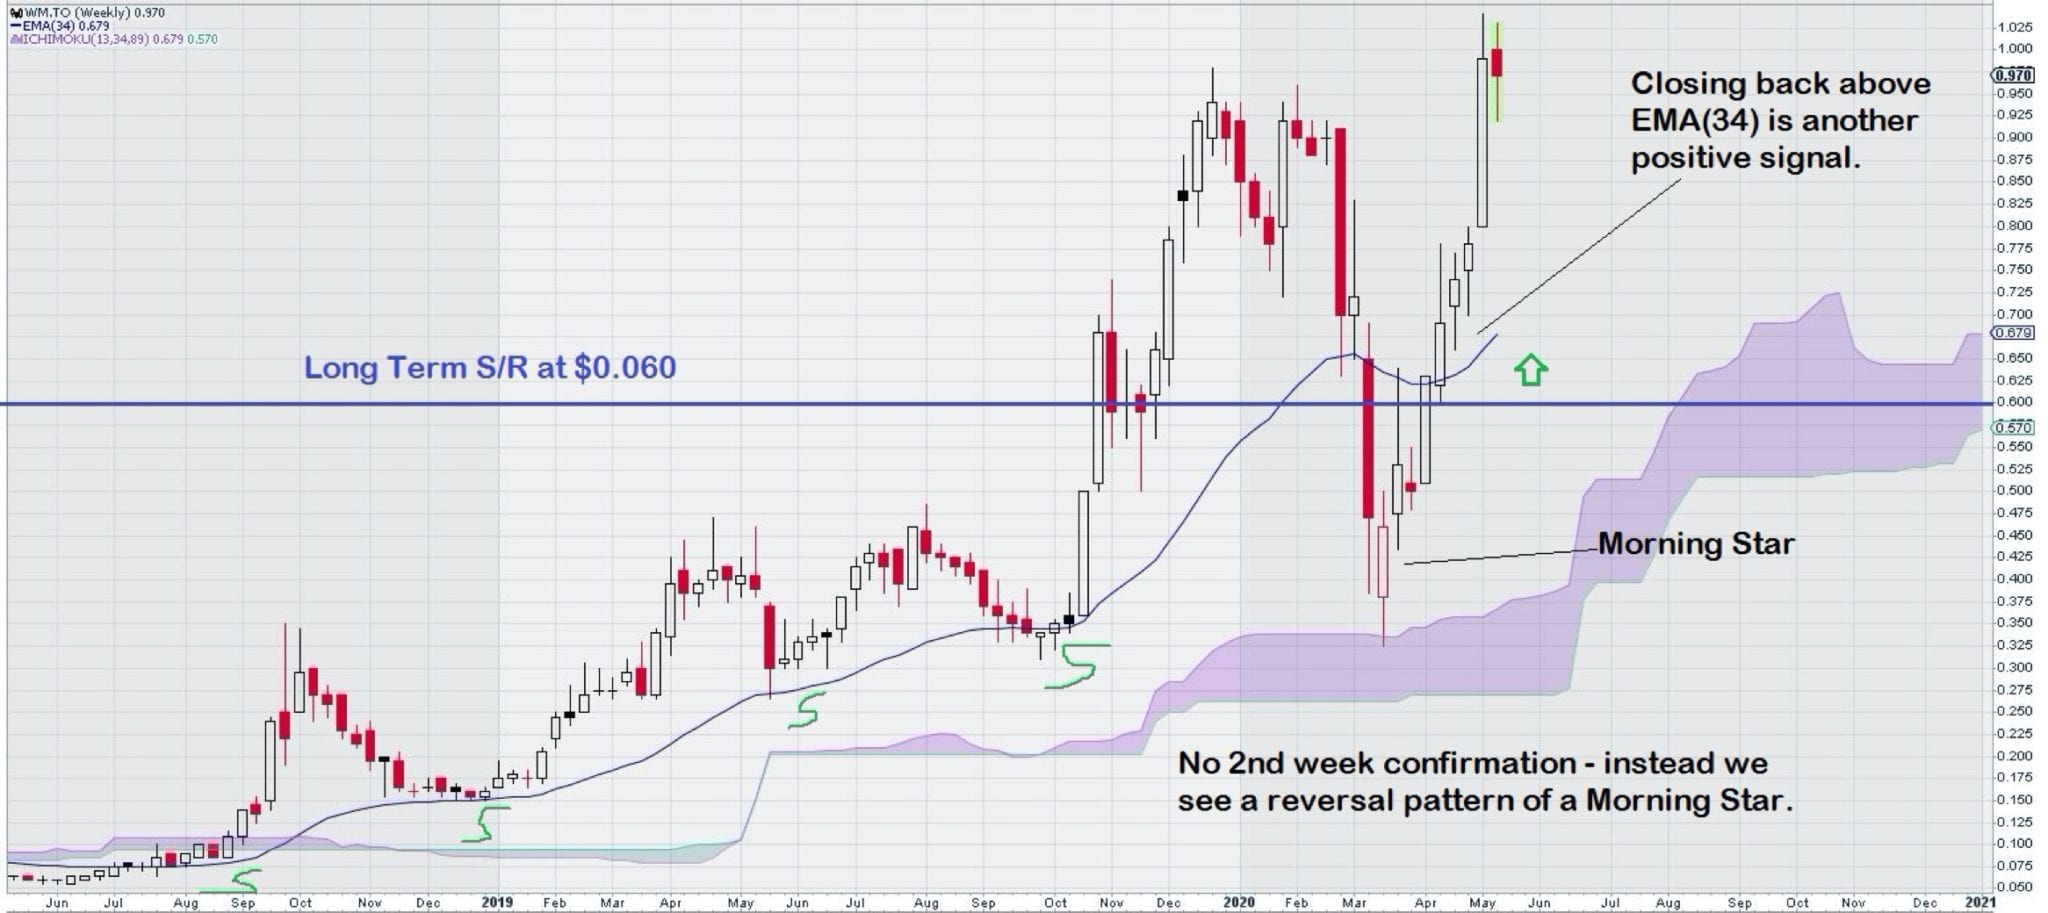
Actually, it did not. Instead, we see an unusual red UNFILLED candle. What does this candlestick mean? (For more detail follow this link:
This trading action is a clue for better things to come. Why? On the second week after the key support/resistance level was crossed to the downside, the open was below the previous close, and yet the close was above the open. This type of trading action tells us that the bulls are starting to fight back and that the next week’s trading could go a long way in suggesting if a “turn-around” is underway. This is exactly what happened to WM.TO.
In the third week of trading, after the key support/resistance level was first penetrated to the downside, we see the completion of something that resembles a Morning Star pattern. (Google search term “morning star pattern” to learn more.)
The trading action shown by WM.TO offers three good trade entry points.
First, once the morning star pattern is completed. This is especially a good signal because the low candle of the three candle set-up for the morning star pattern is an unfilled red candle.
Second, once the well-developed support/resistance level of $0.60 is crossed, and a close above this level occurs, a buy signal is given.
Third, as we can plainly see, the EMA(34), on its own, is another guide that shows good support along the uptrend – once this level is re-crossed from below, it acts as another independent confirmation that we are right in our thinking that there is more strength left in the stock.
This trading example shows that the safety of a three-part trade entry. There is a sound trading rationale to average up twice after the initial trade entry signal.
This example was chosen to highlight that keen attention is required to interpret what is going on in the key “2nd week.” It also shows the importance of defining a key trading level in a stock, and then using that key level as a springboard to trade.
Investors should be aware that they are competing with technical traders with the knowledge of trading that we have just illustrated. Also, there is no reason not to think that artificial trading platforms could not easily incorporate technical analysis into their own trading applications. So how does an “average investor” compete and “win”?
There is another long-standing trading axiom that answers this question. It is “Knowledge is Power.” So, take full advantage of the power of information in the form of the Internet. All that you really need to know has already been posted.
Your challenge is to gather up the information that you need, come up with a plan, and stick with it. Opportunity is right around the next corner if you are prepared to recognize it.
-John Top