
Positive Chart Pattern for Mirasol Resources
TSX-V: MRZ.V
Where Have We Seen This Before?
(Chart Educational Segment 011)
Technical analysts often use this well-worn phrase: “the chart speaks to me”. What do they mean by this?
Today, we will review a trader’s adage that has been highlighted twice before in the Equedia letter: 3 Taps & Out.
Both times we highlighted this particular and very specific chart pattern, the companies that exhibited it made strong gains afterward.
Let’s take a close look at these two stock market “winners” we featured to refresh our memory of what the trader’s adage of “3 Taps & Out” looks like and how to recognize it when we see it again.
First, let’s go back in time and examine a chart for Ely Gold Royalties (TSXV: ELY; OTCQX:ELYGF) that accompanied our first “3 Taps & Out” article written on February 8, 2020.
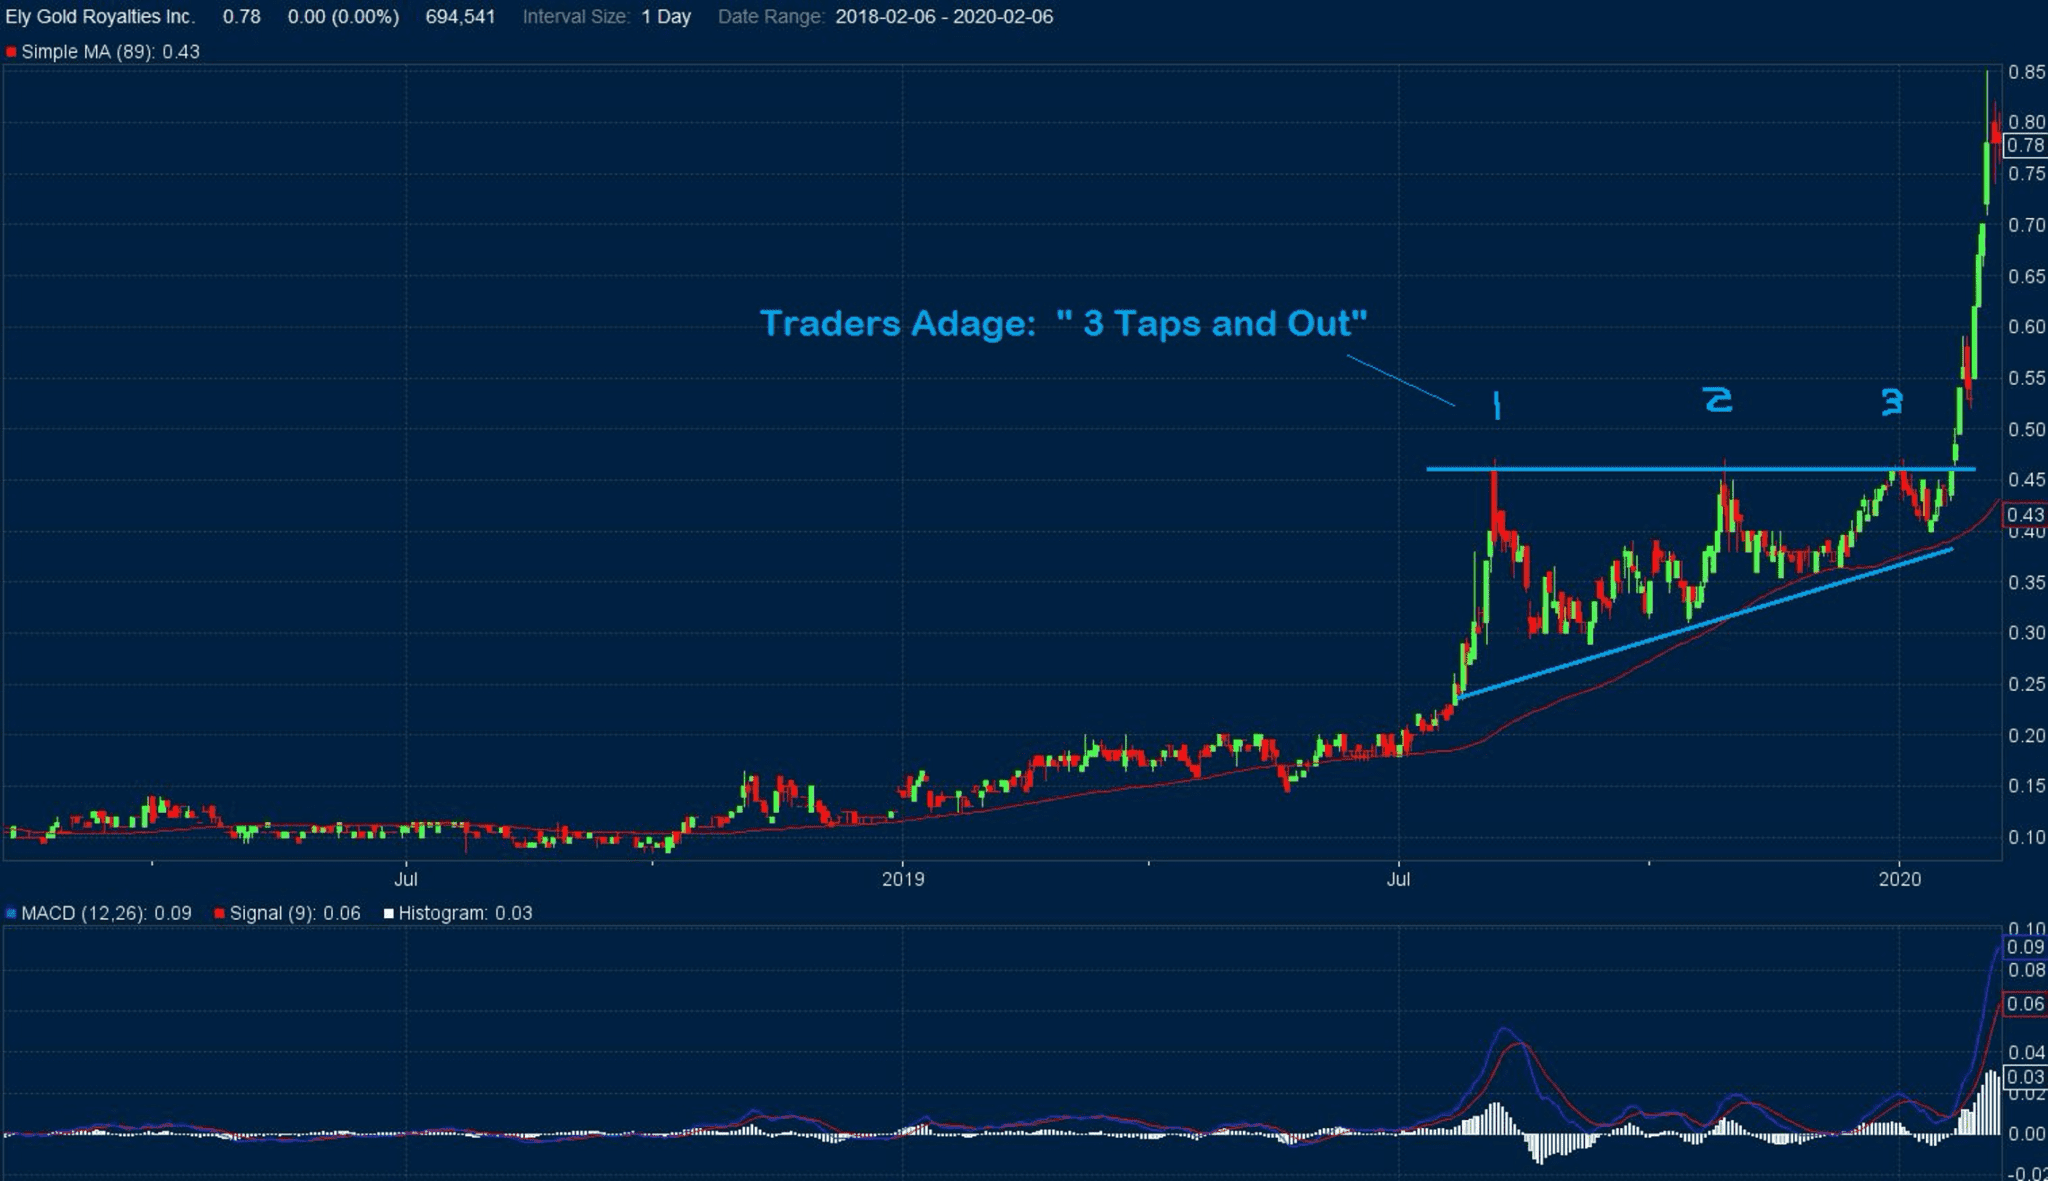
Here is what we had to say about this chart at that time:
“The chart for (TSX-V: ELY-V, OTCQB:ELYGF) shows a tradeable chart pattern: the ascending triangle with a breakout. It also highlights the “3 Taps and Out” trader’s adage.
I bring this particular chart pattern to our readers’ attention because it would not be a surprise to see other similar patterns emerge in the current market environment for gold stocks. After all, the gold industry has managed to endure through a very difficult period since the top in 2011.
We are starting to see the better companies, like the one noted above, complete their consolidation patterns on daily and weekly charts. When these patterns show a break out to the upside, accompanied by a marked increase in volume, then it is probably a good time to pay close attention to the charts.”
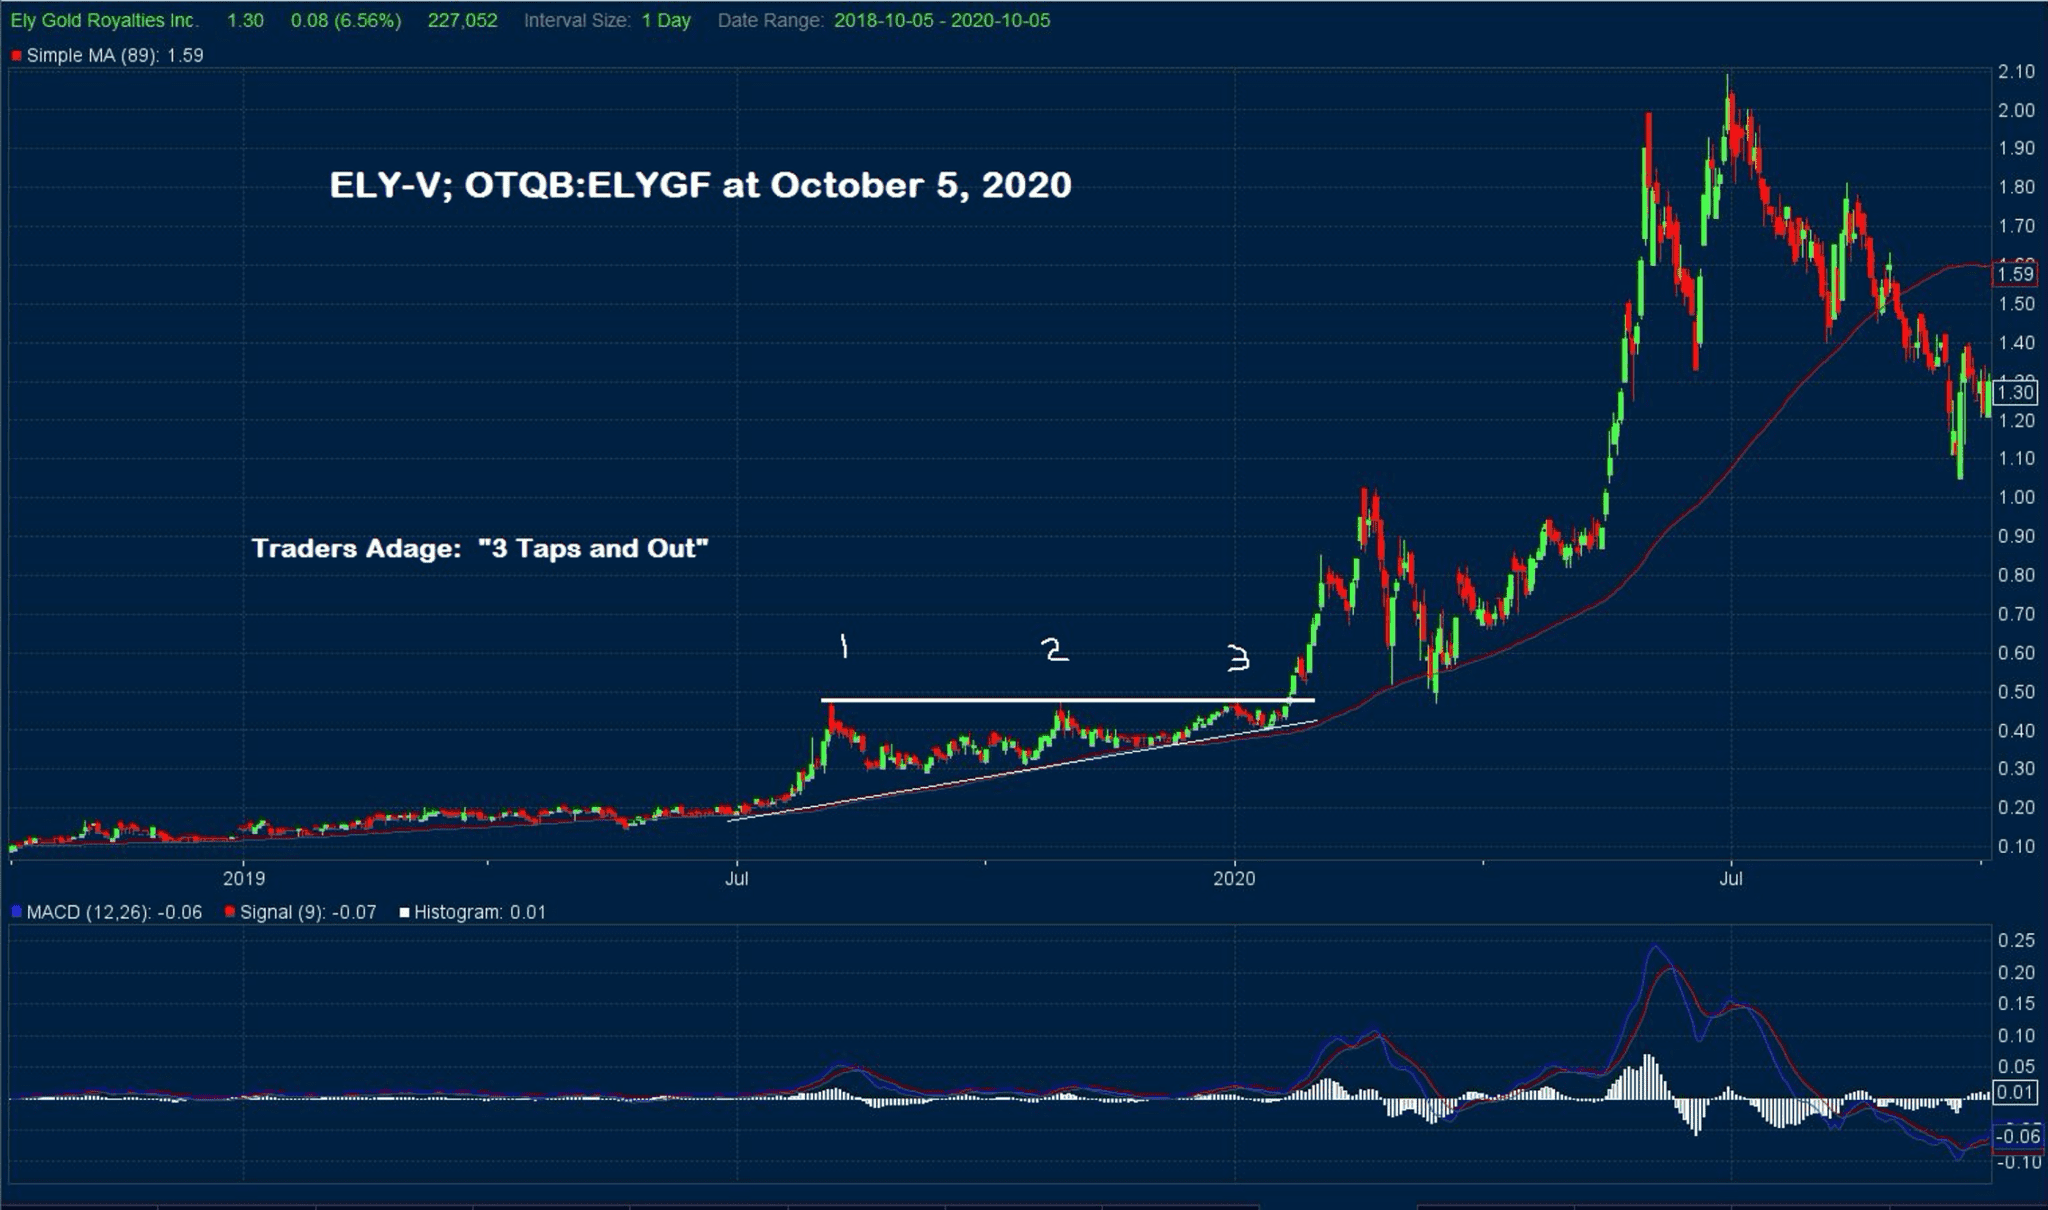
Let’s take a look at the chart for ELY today and see how the stock has performed to date.
 For readers who want a complete summary of the ELY article, here is a link to it.
https://www.equedia.com/traders-adage-a-perfect-example-of-a-three-taps-and-out-chart/
Second, let’s see what we wrote just a month ago.
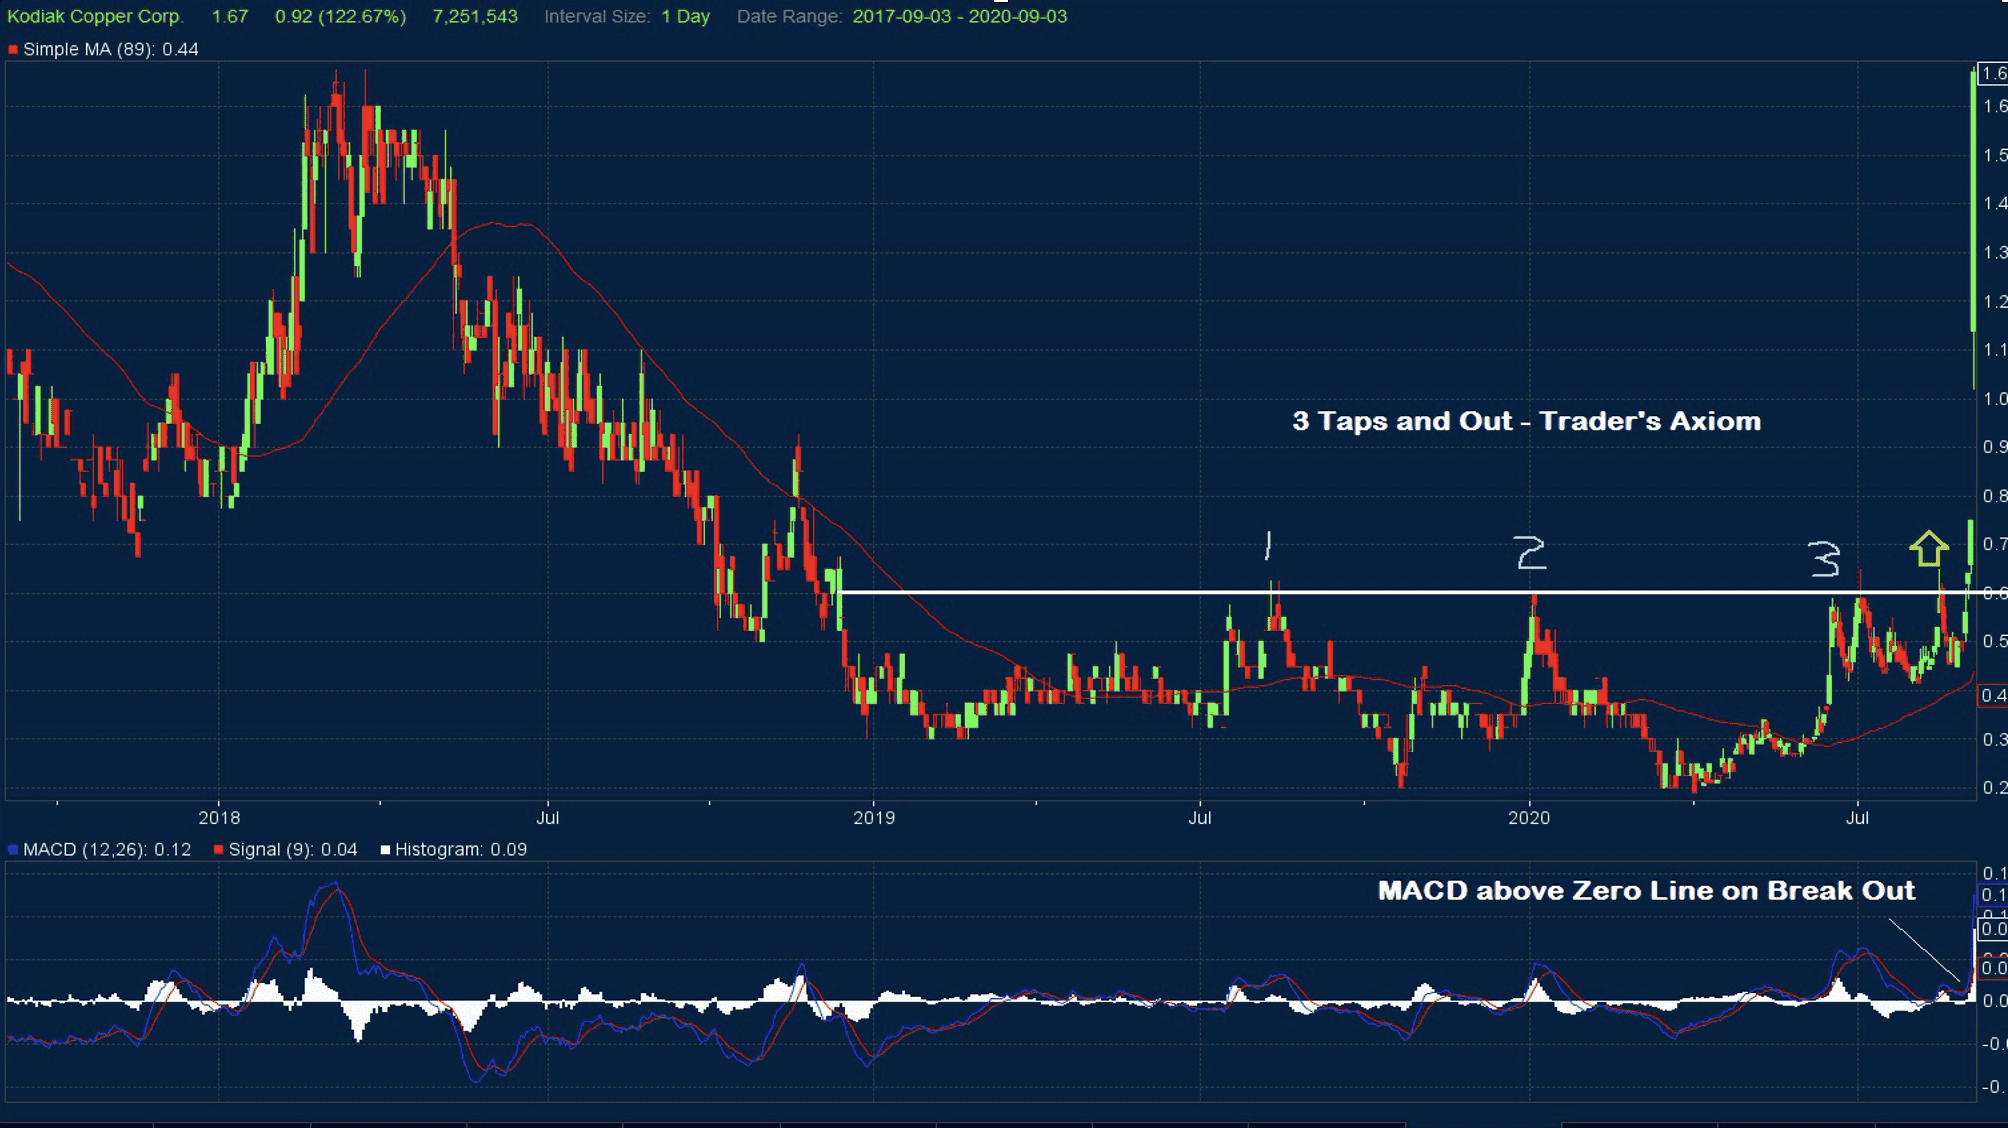
It was another “3 Taps & Out” trading example that featured Kodiak Copper Corp. (TSX-V:KDK). You might recall that the chart pattern wasn’t as “clean,” or well defined as the one for ELY, but it was still quite evident.
In some ways, this second chart is better in the sense that it is a bit harder to distinguish than the first one. We are always up for a technical charting challenge.
Here is the chart from September 4, 2020:
And our comments from one month ago:
“Resource investors who can correctly identify the “Three Taps and Out” chart pattern have a trading advantage. They can use this chart pattern as a means to more closely examine companies to see what fundamentals are about to change, thus resulting in a re-rating.
We hope that the next time you look at a stock chart that you keep this pattern “front of mind.” It could be well worth it…”
A link to the entire article is:
https://www.equedia.com/3-taps-and-out-traders-adage-repeats-again/
Here is what the chart looks like today:
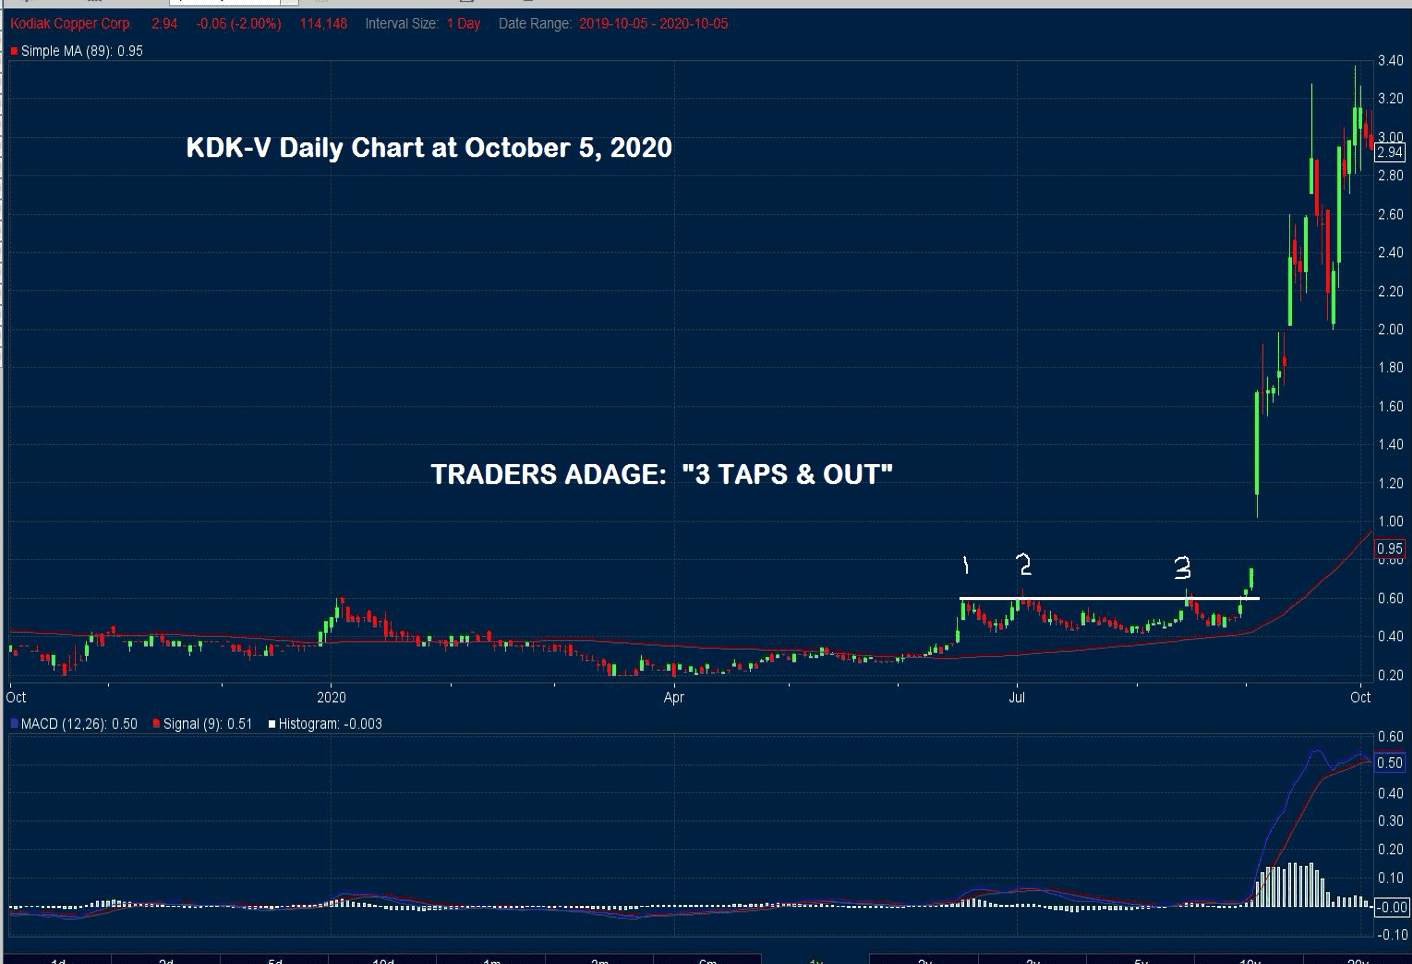
Now that you have seen the “chart power” of the trader’s adage of 3 Taps & Out unleashed, it is time for the next example…
Mirasol Resources Ltd. (TSXV:MRZ; OTCPK:MRZLF)
For those who are unfamiliar with MRZ, the company is a prospect generator with very sizeable and favorable land positions in Argentina and Chile. Currently, exploration activity at 5 of its projects are being funded by its partners, and MRZ is self-funding two of its projects. The focus of exploration is primarily gold and copper.
So what is it about the MRZ stock chart that caught our attention?
You guessed it…3 Taps & Out.
Unlike the two previous examples where we were a bit late in recognizing this favorable chart pattern – this time, we are “early.” As always, the chart for MRZ is “speaking” so let’s have a “listen”:
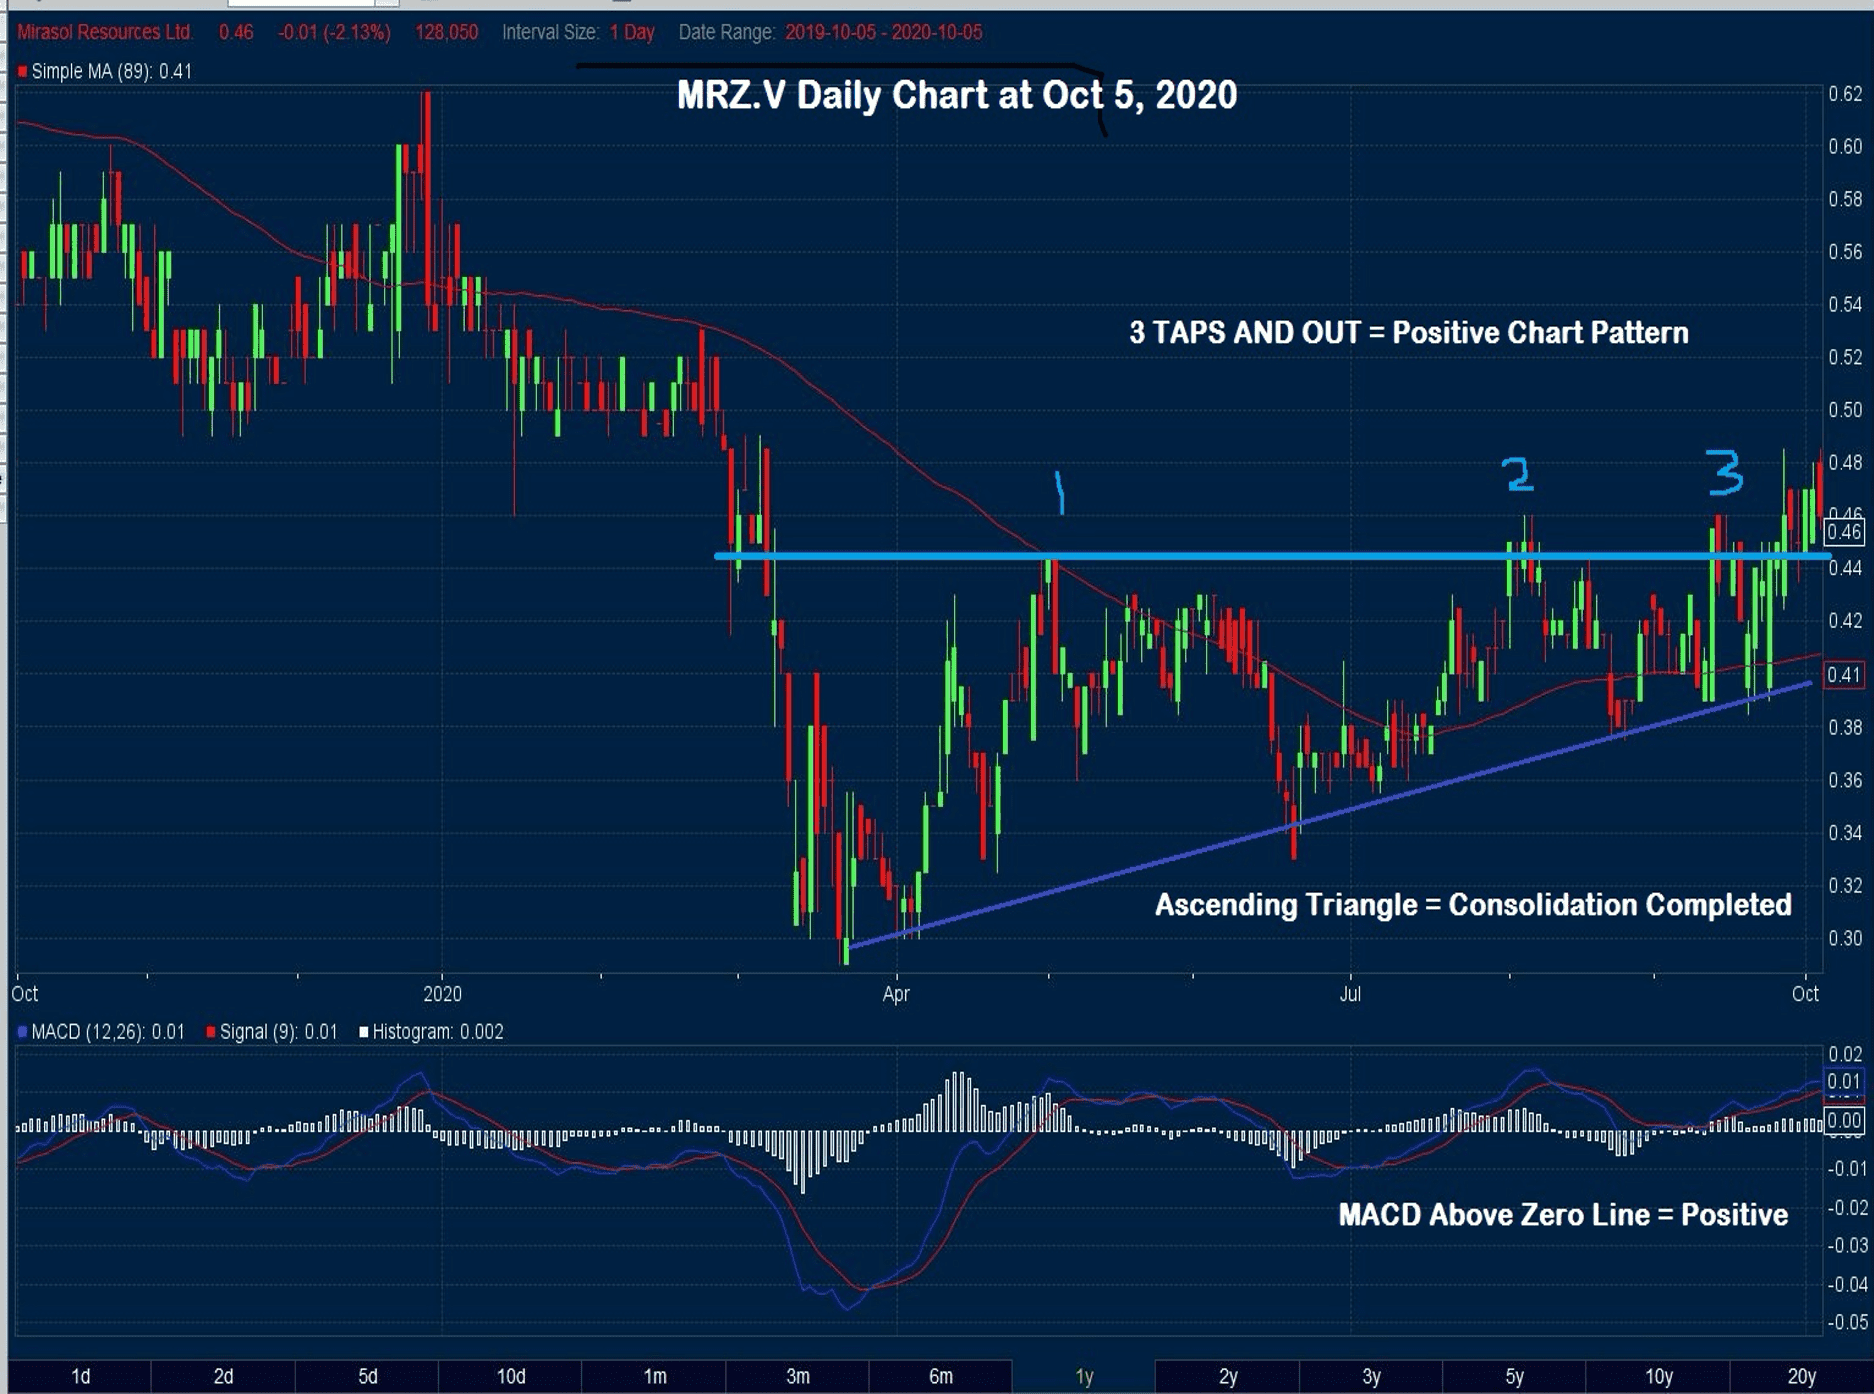
As you can clearly see, the chart is very positive. It is almost a carbon copy of the ELY chart that was consolidating at $0.20 – $0.40 prior to its strong run-up to the $2 level. Scroll back up and take another look at the second ELY chart, and you will see what we mean.
Experience has taught us to recognize opportunity when it is close at hand. We really like the chart pattern for MRZ and believe that this is exactly the type of information that readers of Equedia need to see on a timely basis.
– John Top
Note:
As mentioned before, it is not our intent to try and convert our readers into becoming technical analysts but rather to provide examples of technical patterns that may foreshadow important fundamental change. MRZ is a good example of this. Readers can visit and review the information presented on the MRZ website to try and figure out why the stock chart is speaking so loudly.
We have not contacted MRZ’s management prior to writing this article, and we base our observations/conclusions solely on the strong technical set-up noted in the stock chart itself.
Disclosure: We do not currently own shares of MRZ at the time of this writing.