Are Institutions Finally Ready to Buy Gold & Gold Stocks?
We take a look in this week’s GDX stock forecast.
A week ago, I read an article that discussed how Goldman Sachs increased its gold price predictions. The 3-month target is $2300, and both the 6-month and 12-month targets are $2,500.
It seems like major financial institutions are finally listening.
How do we come to this conclusion? Through our GDX stock forecast.
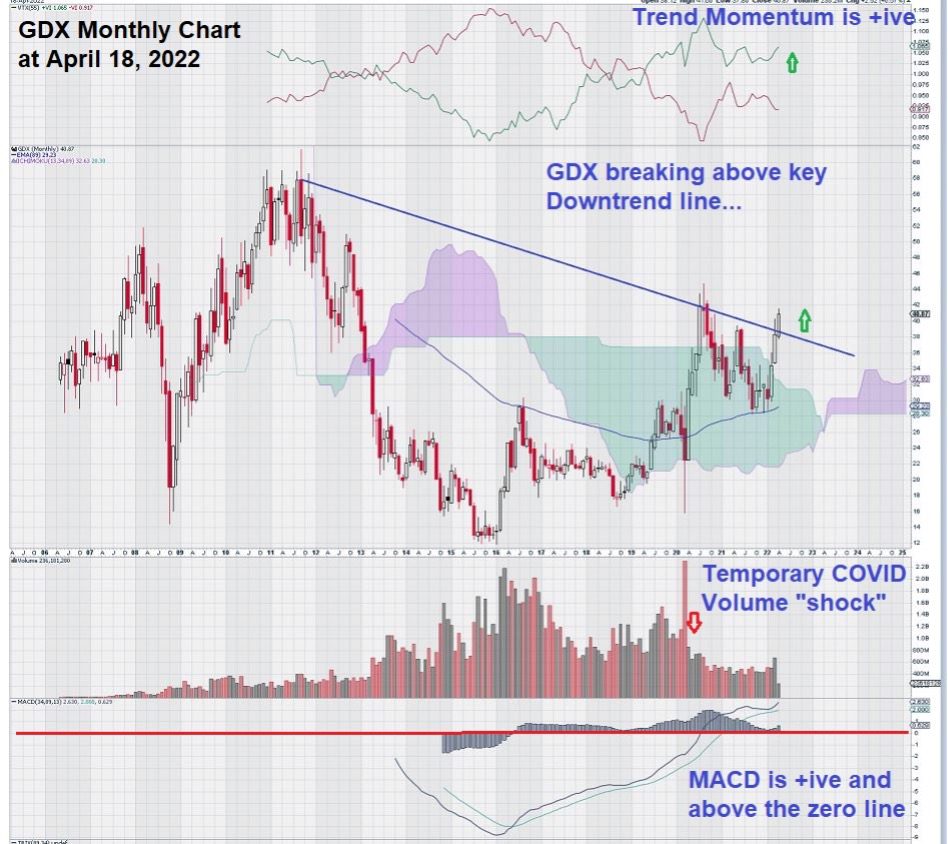
Let’s take a look at the monthly chart for the (NYSE: GDX) (Van Eck Vectors Gold Miners ETF that trades on the NYSE):

We note with interest that a simple downtrend line drawn through the two previous “highs” shows a clear break-out.
Confirmation may come at the end of this month in the form of monthly volume in excess of 500 million shares.
The GDX ETF is highly liquid, widely held, and the premier choice amongst institutional investors seeking exposure to gold and gold equities. This is why the chart above is important. It can be early the signal for another positive multi-year rise for gold.
Some of the larger component holdings of GDX are the major gold miners, like Newmont (NYSE: NEM)(TSX: NGT). A monthly chart for NEM shows an impressive gain over the past six months from $52 to $85.
The gold price has been well supported as it slowly makes another attempt at getting through the $2,000 level. I remember how difficult it was for gold to pass through the $1,000 level – (it took three attempts before finally breaking through).
Somewhere in the recesses of my memory, I recall reading that large “round numbers” are often barriers unto themselves. This was well before the tech stocks/bitcoin/other commodities/equities became priced in the $000’s or $0,000’s per share or unit.
GDX Stock Forecast Summary
Gold is acting very well. For those of us who are up late into the night in North America, we have noticed that gold starts rising in Asia and often continues its rise into the opening of the European markets. It is only when the US markets open that it seems to come under a bit of selling pressure. This observation is made without any “conspiracy theory” conclusions. It is a simple statement of how the global gold trade has evolved. The back and forth day-to-day trading in gold is transparent and is available for everyone to observe.
Perhaps having a war on your doorstep promotes a different response to gold than having it appear on a television screen on a different continent, separated by a vast ocean.
Institutional presence in the gold market is too significant to hide.
We are keeping a sharp eye on the monthly volume of GDX stock and will continue to update our GDX stock forecast as the chart changes. Don’t forget to subscribe to our newsletter to keep informed!
– John Top, the technical trader


