Bitcoin Candlestick Chart Analysis: The Future of Bitcoin Looks Cloudy
Bitcoin has been bouncing around quite a bit lately, but what does it all mean? Has it bounced a bit too far this time? Let’s take a look at the Bitcoin candlestick chart using our familiar weekly chart.
Bitcoin had tested the $34,000 level twice before in the past, and both times it was repelled. Now we see something different. Support at the $34,000 level did not hold.
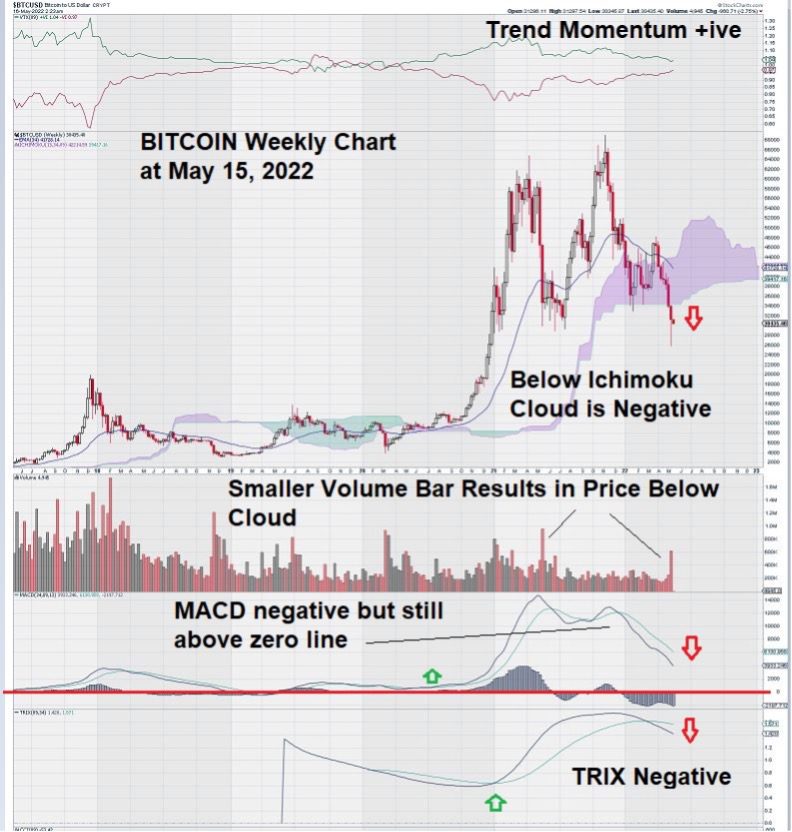
When we look at this weekly chart for Bitcoin, we count seven consecutive weekly declines as denoted by the red candlesticks on our chart.
Our attention is focused on TRIX, the triple-smoothed exponential moving average that takes a very long time to give cross-overs due to our long settings. We see that the TRIX signal line has crossed over the trigger line for the very first time in Bitcoin’s relatively short trading history. This is a negative chart signal that can not be discounted or ignored.
When we look at MACD on our trend settings, we see a strong move lower as the signal line is below the trigger line, and both lines are trending lower with no signs of flattening. Again, another solid chart signal that is warning us of more negative price pressure. Both lines remain above the zero line, but you can make your own assessment of the chart to see how likely this condition is to last going forward.
Volume. The volume chart could be giving us a big clue. Notice that the last down spike in volume produced a much large red candlestick in May 2021. As you can see, it failed to take Price below the Ichimoku Cloud because the price of Bitcoin, at the time, was well above the Cloud. This allowed a rally to ensue.
Now, the price of Bitcoin is below the Ichimoku Cloud.
Let’s take a moment and reflect on what these Ichimoku Clouds represent to understand better the significance of a price level relative to the Cloud. Ichimoku Clouds are simply a visual representation of a series of moving averages plotted forward in time. They show us where, in the future, we can expect to see support/resistance levels based on past trading.
This is why, when an equity, a commodity, or a cryptocurrency like Bitcoin falls below the Ichimoku Cloud base, the alarm is raised.
Think of the base of the Ichimoku Cloud as a strong resistance level. Bitcoin is at a level on the chart where further selling is very likely to inflict further chart damage. Several technical traders may have already arrived at this same conclusion by other means.
So, where does Bitcoin go from here?
Despite laying out all of the negatives, it does not escape our attention that trend momentum remains positive. There is some historical perspective to this observation as we see on the chart that trend momentum also remained positive when Bitcoin dropped from around $60,000 to $34,000 in April/May 2021.
By comparison, this “small drop” seems unlikely to turn trend momentum negative. Longer-term Bitcoin holders would be well served to construct their own trend momentum chart (ours is set at 89 weeks) just to make sure that, regardless of how Bitcoin’s chart is impacted in other areas, it does not lose trend momentum. Loss of trend momentum at this time would have the effect of accelerating the decline in price.
Summary & Wrap-Up
To some, Bitcoin may remain an enigma. Why does it trade in such a volatile manner? How come the trend momentum is not slowing?
Is Bitcoin “invincible”?
We can’t answer these questions. All we can do is rely on our charting knowledge and our long experience with observing how technical analysis can be essential in determining when a trend shift occurs.
As for Bitcoin, it is currently below the Ichimoku Cloud. This puts it in a weakened state. It is vulnerable to future declines in price. This we can say with certainty.
After seven weeks of decline, some traders are no doubt ready to trade against the inevitable “dead-coin bounce.”
Let’s see what happens over the next few weeks, as it is important for Bitcoin to “rise above the Cloud” or at least enter it to bolster bullish sentiment.
John Top