


For the past few months, we have become more and more focused on the weekly chart for both Gold Stocks (S & P TSX Global Gold Index) and gold itself.
Our premise for analysis is simple: we rely on long-term “trend settings” that help us see changes beyond the day-to-day fluctuations in price. Thus, our weekly charts are set up to identify key levels that predict future price direction.
Generally speaking, we try to avoid using daily charts or charts with even shorter duration. This may work well for active traders or even high-frequency algorithms, but we are more interested in longer-term trends, so that is why we stick to our weekly charts.
We even went beyond our normal scope of time and looked at a very long-term chart, a monthly chart dating back to 1971. This chart clearly shows an interesting pattern that would complete with several monthly closes above the previous highs in gold. It also fails with monthly closes below $1400.
Here is the current, updated weekly chart for gold:
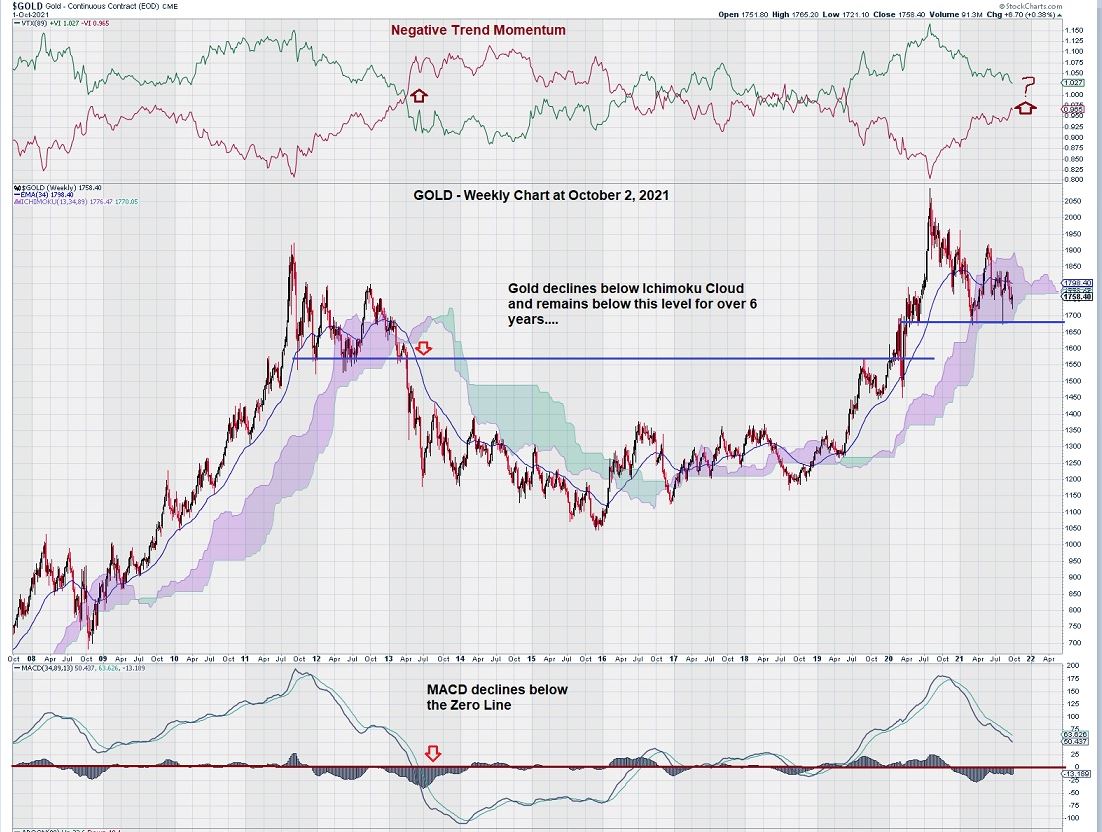
This weekly chart should make gold investors sit up and take careful notice.
There is nothing like a visual comparison of what happened before to what is happening now to give clarity to observation.
Previously, we had expectations that the weekly gold chart was showing some implied strength. Price fell within the Ichimoku Cloud and quickly rebounded to rise back above it. This was temporary.
Subsequently, more weakness ensued. MACD, although it was showing some early signs of “flattening,” instead, continues to decline. The signal line is below the trigger line, and both lines seem intent on testing the zero line.
The chart shows us that meaningful advances in the gold price do not occur with MACD at or below the zero line when we use our trend settings.
Looking at the graphic that sits above the weekly gold price chart, we see that the action in Trend Momentum mirrors what happened the last time the gold price broke down below the Ichimoku Cloud. For now, Trend Momentum remains positive, but for how much longer…?
Now we look at how to analyze the way we look at gold, should it break below the Ichimoku Cloud:
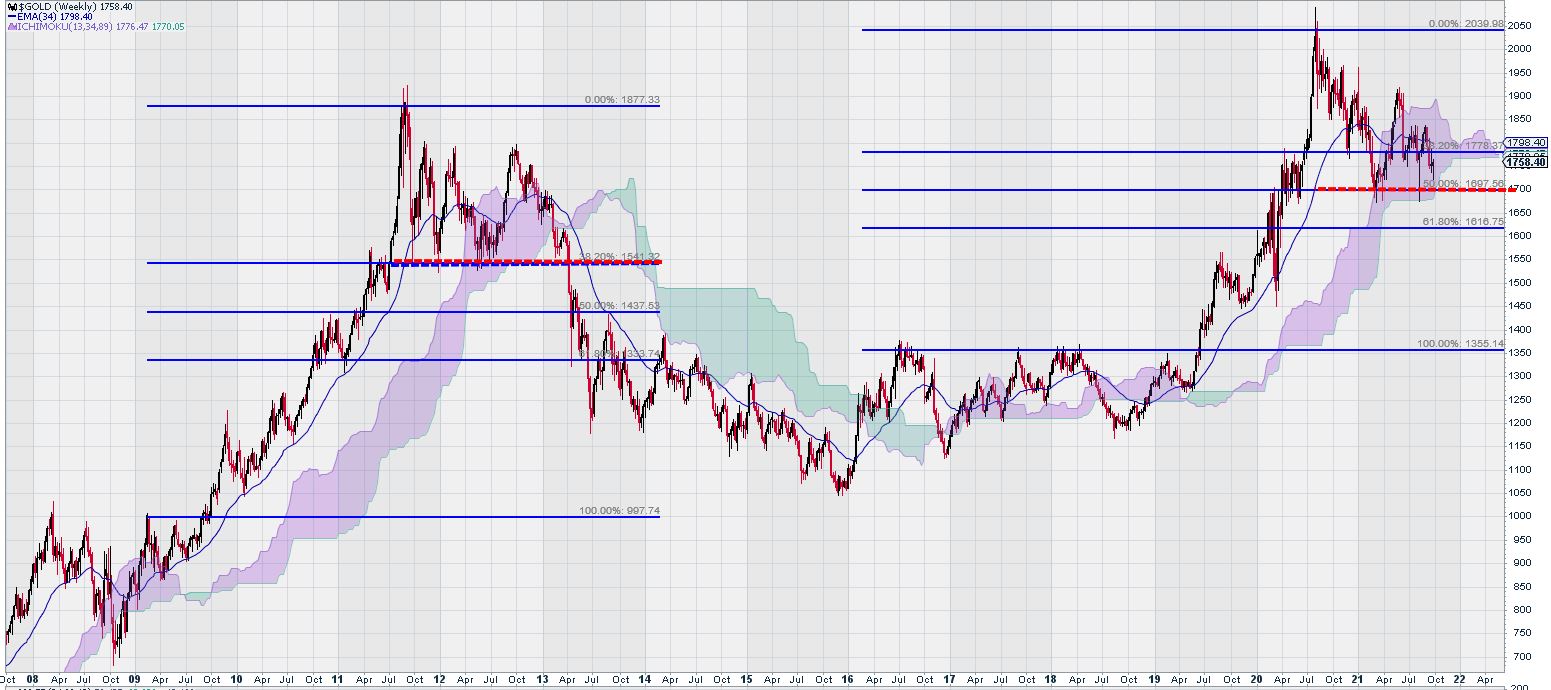
Here we see how using intermediate lows – $1000 in 2009 and $1350 in 2019 – gives us levels of Fibonacci support. Currently, the 50% Fibonacci retracement level is at $1700.
(The red line in the second Fibonacci study.)
The last retracement level for gold is around the $1620 level.
Declines below the $1620 level for gold will invalidate the use of the intermediate low of $1350. The next step will be to recalculate the Fibonacci retracement levels using the gold price low of $1050, which occurred at the end of 2015.
Summary and Wrap-Up
On August 23, 2021, we penned an article entitled, “Are Gold Stocks Leading Gold Lower?”
This conclusion was based on an observation of the weekly chart for gold stocks (S & P TSX Global Gold Index) that was showing weakness. The chart weakness was comparable to the weakness displayed by gold stocks in the previous decline after reaching a high in 2011.
Now we are starting to see the same thing for gold.
The current weakness in price is reproducing chart patterns that we have seen before.
Before we become too negative on our outlook for gold prices, based on strong technical signals on the weekly chart, it is important to keep any future declines in gold constrained by what we see in the monthly chart that lies above the weekly one. The monthly chart has set down a “line in the sand” value of around $1400 as the level by which the multi-decade long cup and handle pattern would become invalid.
Our first look at the long-term monthly chart for gold was at the end of July 2020, and our observations at that time are still intact and valid today. It is useful to recall that it took over six years for gold to break above $1350/$1375, so it is conclusive to say that this level is key for gold to remain above.
Epilogue
Recently, two large gold companies, Kirkland Lake Gold* and Agnico Eagle Mines, proposed to merge in an all-stock transaction defined as a “merger of equals.” The combined corporate entity would have a mineral reserve base of 48 million ounces of gold and have a market capitalization of $24 billion.
Senior executives of major gold companies don’t fear the lower gold prices that seem likely in the near future. Instead, they see better days ahead.
*Regular readers of the Equedia Letter will recognize that Kirkland Lake Gold was the Company that acquired one of our past featured companies, Newmarket Gold – one that potentially gave early shareholders a 20X plus return. We are currently and still invested in a new gold producer created by that same management team. Find out more by clicking here.
– John Top, the technical trader


Everyone in chart analysis is using different kind of indicators that work best from him or her. And they sometimes lead to different conclusions.
The monthly chart is telling me this: we have a ‘short term’ sell signal (with meaning on a monthly a few months long movement) That might bring gold to 1480$, which of course won’t change the long term trend which is highly bullish! Volume is strong and increasing possibly highlighting accumulation by strong hands.
Weekly chart: Same analysis with a target of 1540$. However relative volatility is too high to sustain that move. Objective may not be reached ….
Back on the daily chart which has turned bearish. Target price is 1670$ where a strong support seems to be in place.