


Have you ever wondered what $10 trillion could do?
You could write off one-third of US debt…
You could fund the bankrupt Social Security and bring universal healthcare to everyone…
Heck, you could even give every American a $33,000 down payment and solve the homeownership crisis.
And yet, of all things, Uncle Sam chose to spend $10 trillion to fight a virus with economic policies.
And while the “emergency” is over, the spending not so much.
Listen via podcast instead
During its first term, the Biden administration passed two mammoth spending packages:
- America’s largest infrastructure bill, committing $1 trillion to…well, no one really knows
- And a record $738 billion climate bill disguised as an inflation reduction act
That totals $12 trillion for ad hoc expenses – and that’s on top of regular expenditures.
And there’s still room for more “COVID” spending. Take a look:
![]()
To put things in historical perspective…
With only 1.5% of that amount ($180 billion at today’s value), Truman rebuilt half of war-torn Europe after WWII—known as the Marshall Plan.
So, was it worth it in the end? Did these trillions in COVID response spending benefit anyone other than Wall Street?
Let’s look at the hard data to find out.
Bye Bye Savings, Hello Debt
Thousands of dollars in stimulus checks and exploding nominal wages gave the impression that the trillions in COVID response spending benefited everyone.
At least that’s what the Biden administration claims:
“You know, and as inflation is coming down, take-home pay for workers is going up. Workers’ wages are higher now than they were seven months ago, adjusted for inflation.“
But if you zoom out past that cherry-picked timeframe, you’ll see that workers are actually much worse off.
Look at how inflation-adjusted personal income changed during Covid:
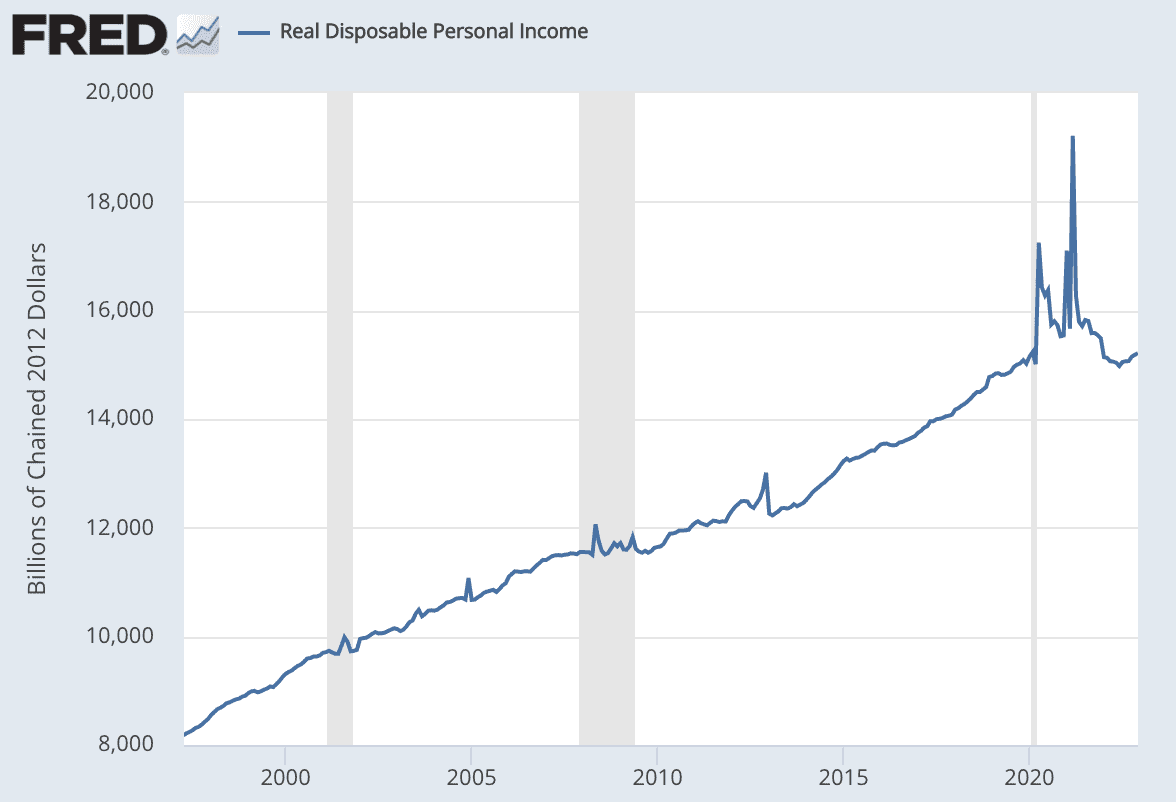
Real disposable income (income adjusted for inflation) has not only dropped sharply, but it’s back below pre-COVID levels.
What about savings? After all, while holed up during Covid, people saved up the largest pile of money in history.
It turns out those savings are now gone:
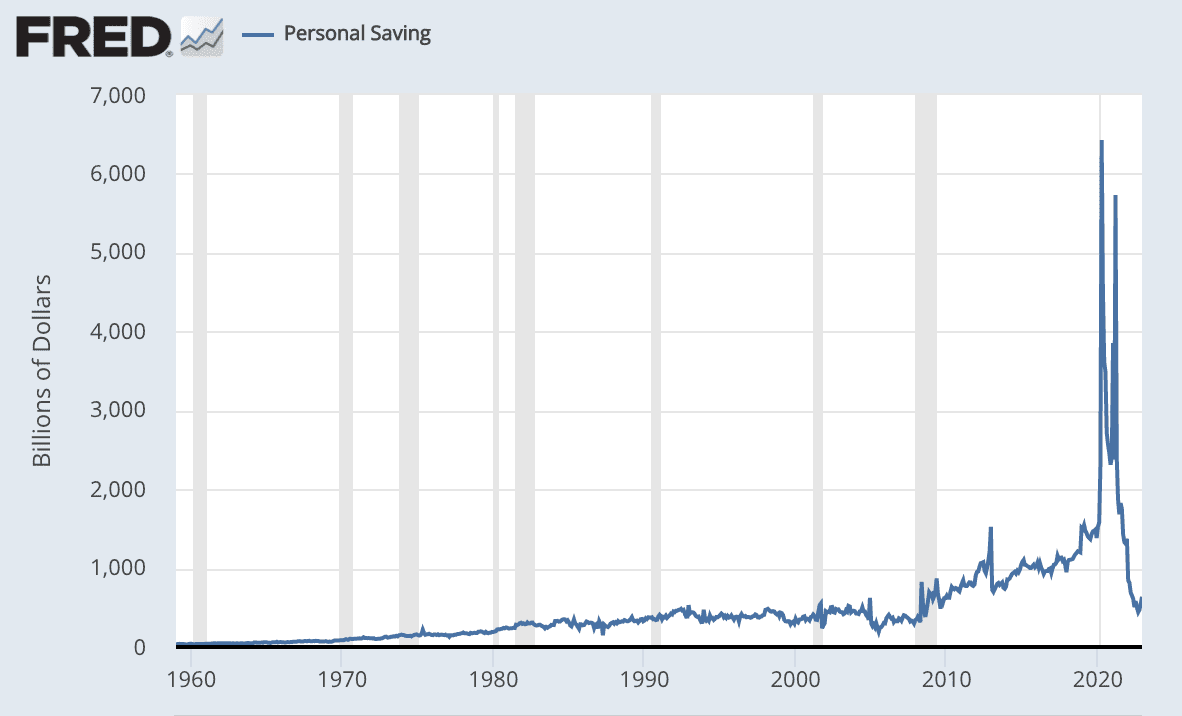
In fact, Americans now have the lowest cash cushion since the 2008 Global Financial Crisis.
And based on the savings rate, which shows what percentage of income Americans can put aside, this cushion isn’t growing anytime soon:
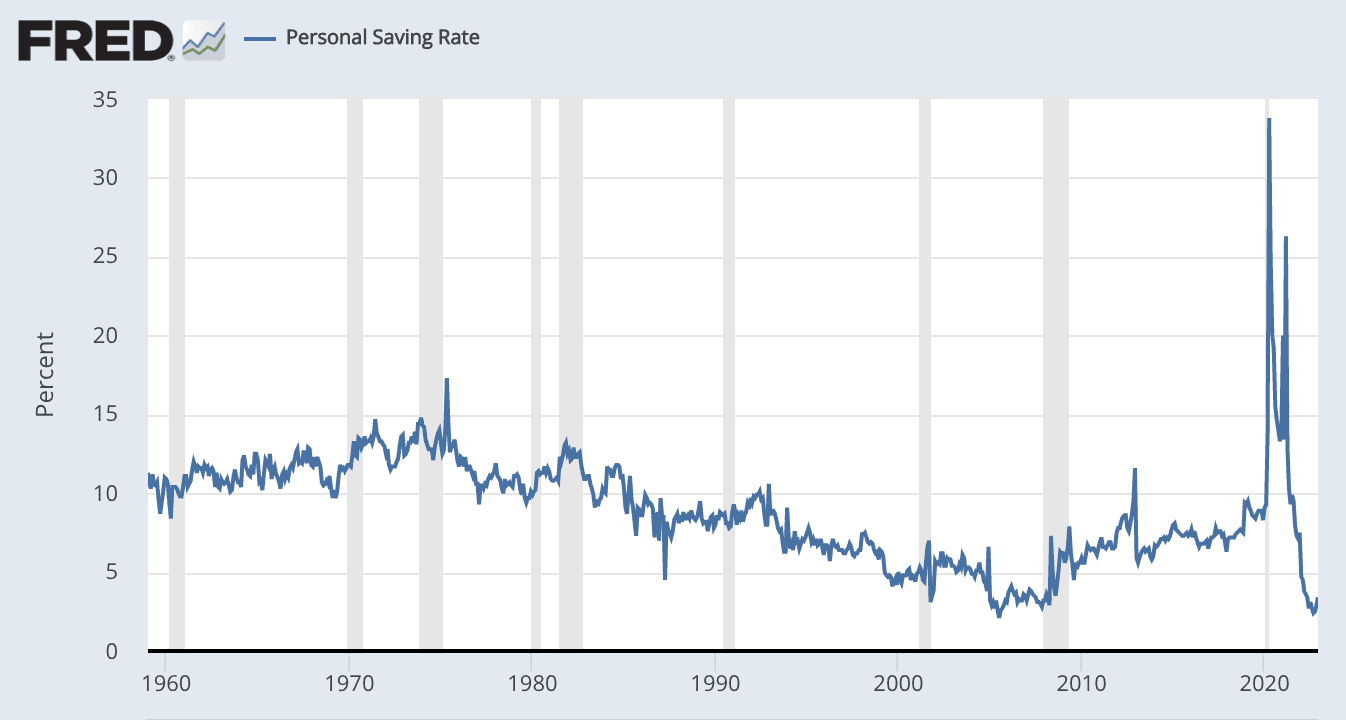
Today Americans put aside, on average, just 2.3% of their paychecks—compared 10% before Covid spending.
Since 1959, there has been only one month when the savings rate was that low.
According to Fed data, households in the top half of the distribution hold most of the excess savings – meaning the bottom 50% have next-to-nothing to fall back on.
And the Fed says the worst is yet to come.
Via the Fed:
“We expect savings to continue dwindling rapidly as fiscal support is now in the rearview and households return to relying on labor earnings and any remaining savings to finance spending.”
Where did all the trillions of dollars go? Maybe it was used to pay down debt?
Pile on the Debt
At the beginning of the “pandemic”, consumer loans did drop:
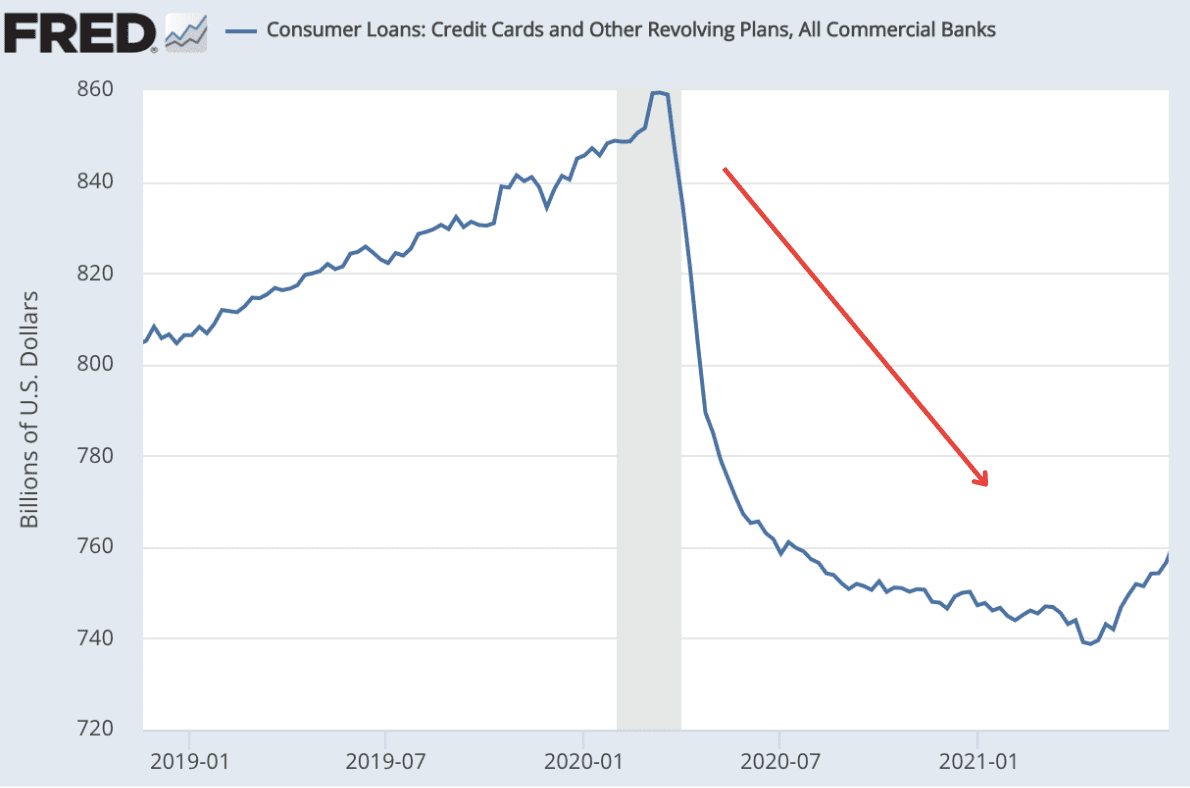
But once inflation caught up to the money supply and living costs exploded, households began piling up debt like there’s no tomorrow.
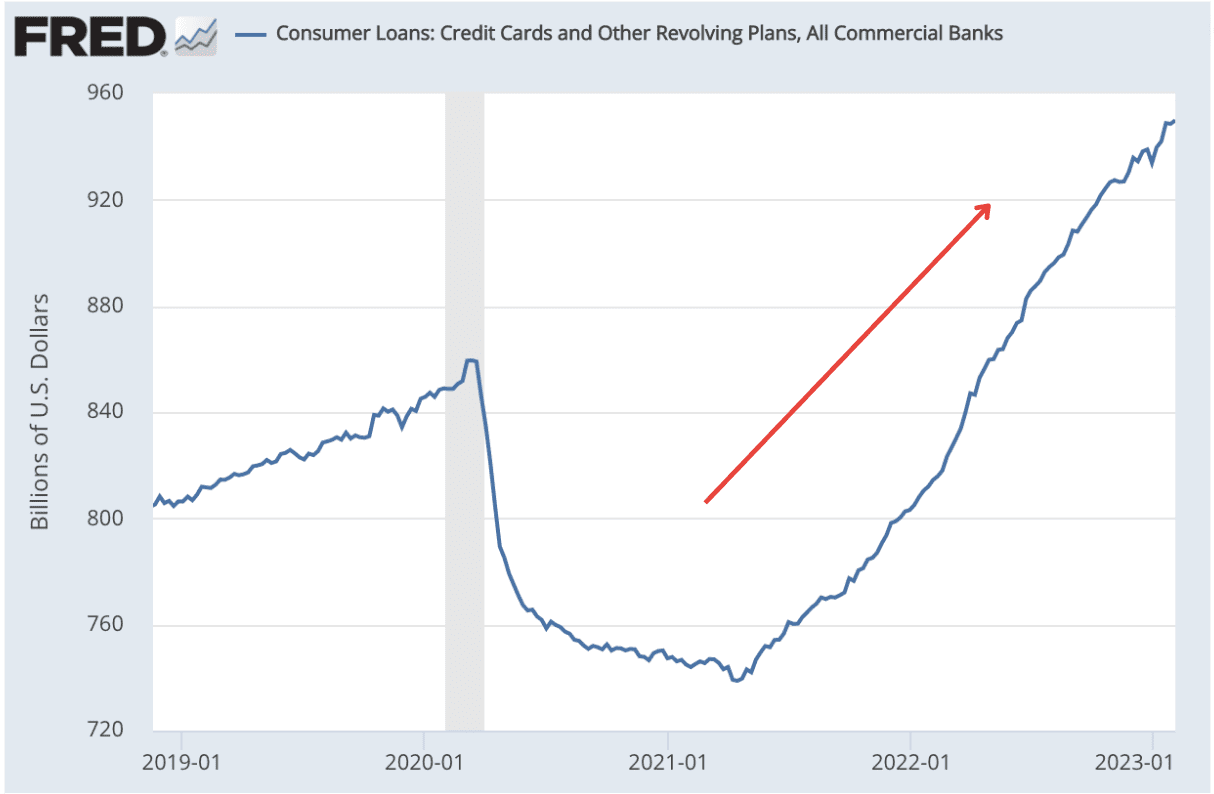
And that includes the most expensive debt of all: credit cards.
According to credit reporting agency TransUnion, in 2022, credit card balances hit an all-time record, spiking nearly 20% from the year before.
Via TransUnion:
“At the same time, more consumers are leaning on credit to afford increasingly expensive necessities, like food and rent.
That helped propel total credit card debt to a record $930.6 billion at the end of 2022, a 18.5% spike from a year earlier, according to the latest quarterly report by TransUnion.”
More alarming, most new credit customers were non-prime borrowers:
“As the number of credit card accounts in the US rises, more new customers are subprime borrowers, generally meaning those with a credit score of 600 or below, according to TransUnion.”
Such desperate debt accumulation tells us a lot about those who take on that debt.
These people aren’t swiping that card to buy a 77-inch Oled TV or a fancy vacation in Paris. As TransUnion data shows, they are strapped for everyday necessities like food and gas.
Meanwhile, Powell touts growing spending and how “resilient” the economy is.
If that’s the case, can’t people just cut back on expenses?
The Misdirection
There’s a widely-held misconception about spending and inflation.
And it’s downright ignorant to see it adopted by policymakers who are, presumably, armed with all the data in the world and swaths of Ph.D. economists.
The theory goes something like this: Despite high inflation, people are still employed and spending more, which means that the “economy is too hot.”
Here’s a snippet from one of Powell’s addresses on inflation.
“Powell suggested that higher rates from the Fed could slow consumer spending enough to reduce that outsize demand for workers, which would, in turn, reduce wage growth to a level that wouldn’t boost inflation.
“This is a labor market that is out of balance,” Powell said, which he acknowledged was good for workers, because it has meant higher pay for many. But those wage gains can also lead companies to raise prices to offset their higher labor costs.
“We need the labor market to be sustainably tight,” he said.”
In the eyes of the Fed, inflation is the fault of “lavish” consumers. As such, the Fed has to rein this lavishness in.
The Fed intentionally mixes up cause and effect by blaming the people, but in reality, the increased spending isn’t the cause of inflation.
If a carton of eggs cost you $3 in 2019, and now it costs $6, will you buy half as many eggs to feed your family?
Probably not. You’ll likely buy the same carton of eggs, but spend more to do it.
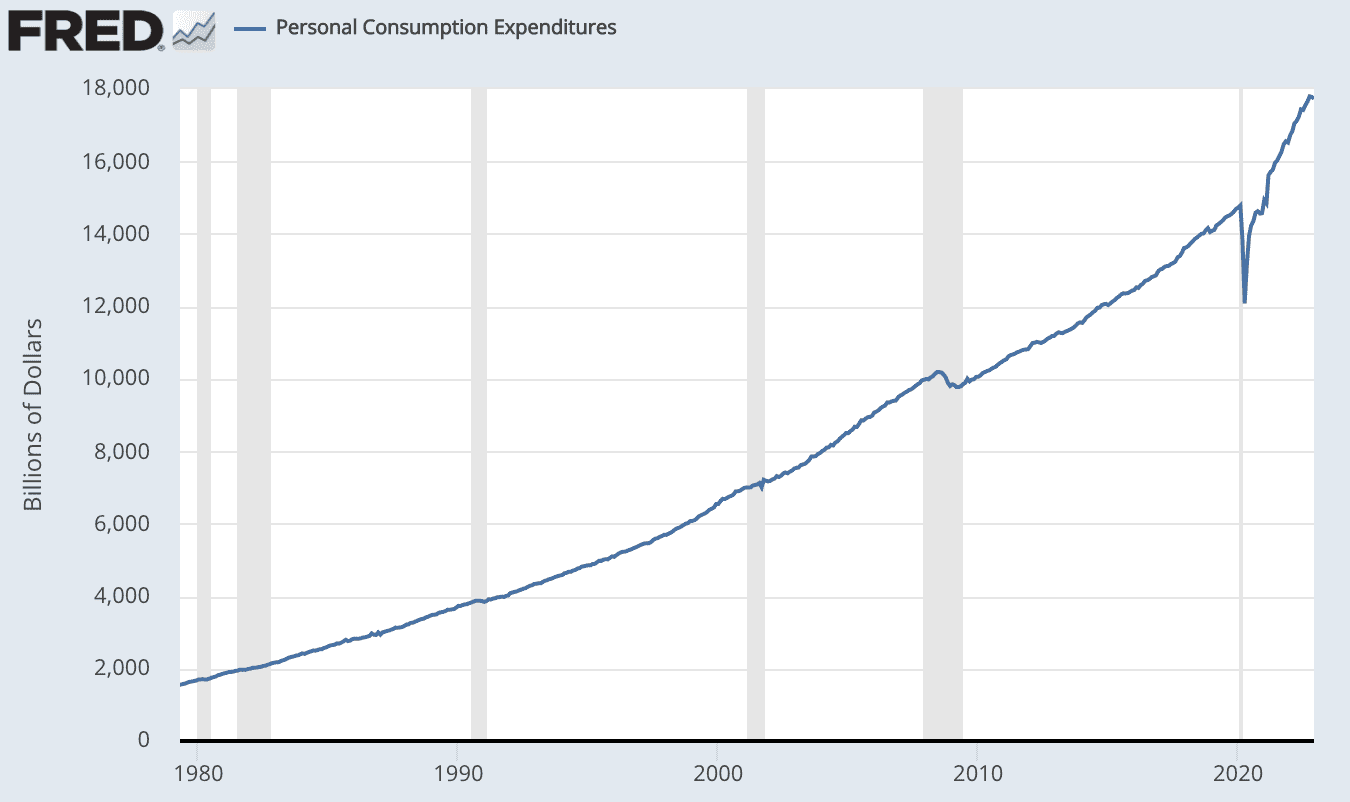
This is why spending in nominal terms, which is often cited by the Fed and the mainstream media, has gone parabolic.
But if you adjust for inflation, you’ll see that spending is just on trend:
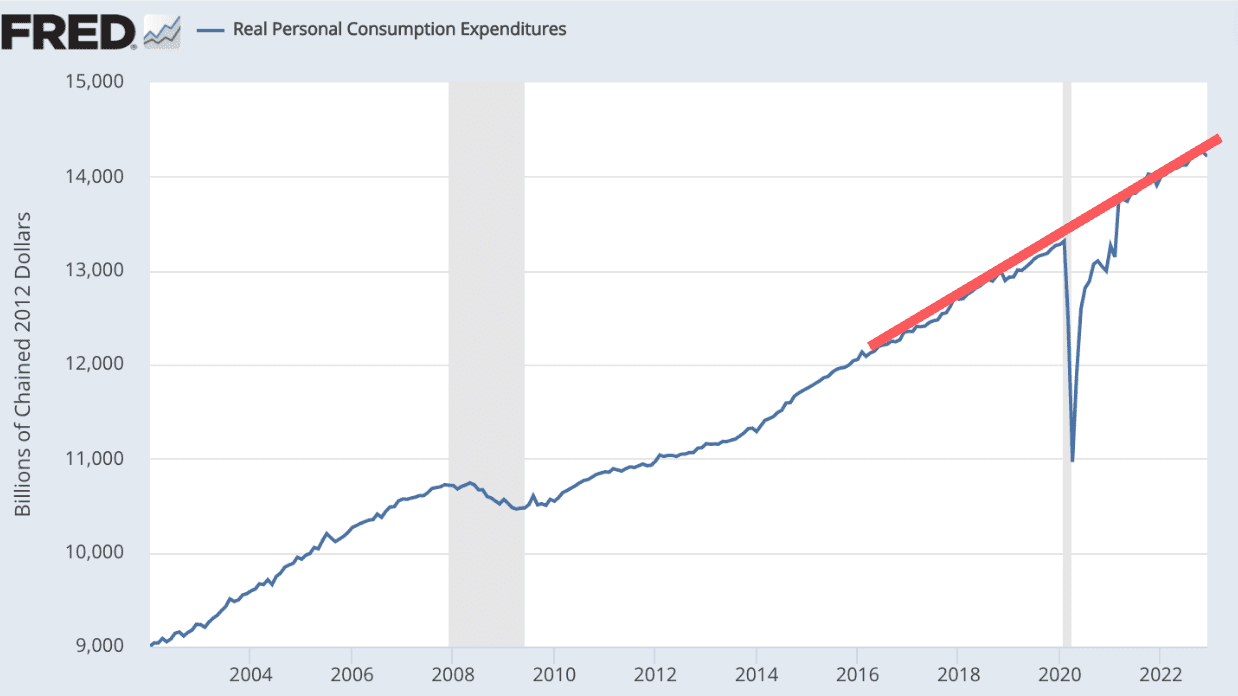
In other words, people are spending more to make up for rising prices.
That’s a fact.
Combine that with exploding credit card debt, and it’s evident that this spending isn’t meant to pay down debt, nor is it voluntary lavishness.
As counterintuitive as it sounds, it’s a sign people don’t have enough to get by.
Where is the Money?!?
Let’s put this into perspective one more time.
The government and the Fed have unleashed more than $10 trillion over the past few years—and counting.
If that money had been handed out directly to the people, every single American would now have $33,000 in their bank accounts. But they don’t.
Meanwhile, two years in, the average American is worse off than they were before all this spending.
This obviously doesn’t add up.
If the real economy isn’t better off after the government sank $10 trillion into it, where did ALL of that money go?
The answer is asset prices.
How to Turn $10 Trillion into $30 Trillion
We all know that stocks have done exceptionally well during Covid.
But let’s put that in numbers…
From 2019 to 2021, the market cap of American stocks skyrocketed from $34 trillion to $52 trillion.
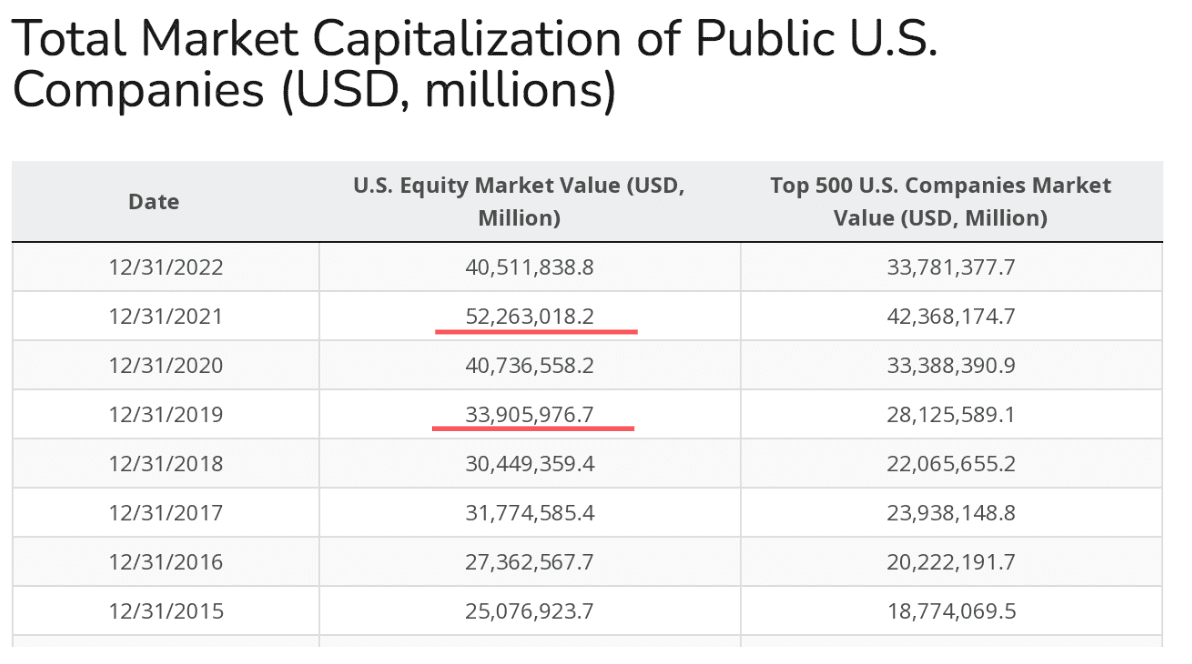
That’s $18 trillion in paper value…OVER TWO YEARS.
In the entire history of capitalism, wealth has never been accumulated so fast.
Meanwhile, the housing market added approximately $10 trillion. In 2021 alone, it gained a record $6.9 trillion—doubling the previous record in 2007.
Via Zillow:
“US housing gained a record $6.9 trillion in 2021, nearly doubling what was previously the largest annual gain of $3.7 trillion in 2005. The full US housing stock is now worth $43.4 trillion, according to a new Zillow® analysis.”
That explains why the cost of a typical home in the US today will run you $411,000.
Check this out:
“House prices are so high that even the middle earners can’t afford to buy and have to rent.”
Meanwhile, in Canada, the average home is now over C$700,000.
But, if you had knew what the $10 trillion in COVID response spending was truly for – that is, to boost asset values – then you could have tripled your wealth.
Unfortunately, most people were too busy trying to pay bills and feed their families through inflation.
Financial Engineering
Our governments have fooled you into thinking they’ve showered you with help and money.
They wired everyone a couple of measly checks and, for a little while, they covered those who’d lost their jobs.
But all that was just breadcrumbs compared to how much was ultimately spent.
If you combined all stimulus checks and income support measures, including unemployment benefits, in the US, you’d get $1.9 trillion.
That’s barely one-fifth of all that was spent.
Go check it out for yourself on Covid Money Tracker.
The rest ended up in assets, and by way of financial engineering (e.g., buybacks), it trickled up to Wall Street.
(Read “The Biggest Dealer in the World” on how this scheme works.)
Meanwhile, more than half of Americans have been priced out of home ownership.
Is there any wonder income inequality jumped in 2021 for the first time in a decade?
Do as They Do, Not as They Say
Living paycheck to paycheck is a rat race to the bottom.
No matter how much the government spends, none of it will go to solving real problems.
The ruling class will always ensure federal dollars end up where it serves their best interests.
And if you aren’t part of this group, the only way to make something out of it is to piggyback on those “interests.”
That is, buy the right assets.
That’s why, despite what the experts told you over the last decade and throughout the “pandemic,” we’ve encouraged readers to stay in the stock market and convert their returns into hard assets. There was simply too much money in the system with nowhere to go but into financial instruments such as the stock market and real estate.
And while the market looks shaky, there’s still plenty of money on the sidelines.
Lastly, while it appears that $10 trillion of spending simply vanished, it didn’t.
It just went to those who knew how to take advantage of it.
Stay tuned for more.


Stayed in the market like you said and lost 20% in the SP500 and 33% in the Nasdaq last year. should have sold and gone to the sideline.
Here are some examples: https://www.equedia.com/think-inflation-is-over-think-again/
And here: https://www.equedia.com/is-a-housing-collapse-coming/
And here: https://www.equedia.com/hyperinflation-warning-europes-looming-blackout/
(“ It could be a volatile time for stocks and every other asset class. Meanwhile, gas prices may appear to have settled, but we suspect it will be higher in the coming months if Russia makes good on its threats.”)
Sorry i missed that.. what threats from Russia now we need to worry about??
We told readers to stay in the market since 2008 and at the beginning of COVID. However, last year, we said the market was looking weak and inflation and economic woes will take a toll, especially with the rise in interest rates. The time to get back in the market further is when the Fed pivots by either delaying further rate hikes or reversed course – if the Fed signals a reversal and drops rates, the market will soar.
Please feel free to go back to our archives to see how we told readers that the rise in interest rates will hurt the market last year.
Hope this helps.
By forcing companies to pullback, alias a recession, they will not need workers. Behold! The workers shortage is solved. Back to low, no pay increase employment. The Fed has the back for the rich. End the Fed!
The Fed is just the institution run by a Fed governor,chosen by the President.The Fed wouldn’t have a problem,if Americans didn’t vote for more govt spending,while voting for no tax increases.Government deficits aren’t caused by the Fed.
The adminstration,Fed and other politicians are just salesmen.They promise lots of free stuff,which the greedy ignorant voters go for.So,the voters are getting what they deserve.The few that know what’s going on,should be able to hedge themselves through smart investments.Most people are too lazy,to spend the time to learn how to invest.It’s easy for the fools to blame the rich for their problems.
I could not find where you wrote about Trump’s 2020 $5.2 Trillion usd. inflation starting stimuluses. Then I realized this is a Right-wing version of history.
Why is this a right wing version? Because the author is writing about todays inflation and todays spending?
Did you forget? Trump isn’t in power anymore.
The Left always go to right wing anytime they don’t agree with something. Do you even know the difference between right and left wing?
AMEN!!! THE DEBT CONTINUES TO GROW AND THE WEALTHY GET WEALTHIER. THIS SITUATION WILL CRUSH OUR COUNTRY, AND CRIME, EXTREMISM, DIVISION OF US CITIZENS WILL CONTINUE TO GET WORSE. BANKS ARE NOT YOUR FRIEND, THEY ARE DEALERS IN DEBT.
“Gold is the money of Kings,
Silver is the money of Gentlemen,
Barter is the money of Peons,
Debt is the money of Slaves.”
Well, once Trump and Bush finished putting the country into further debt, the country has landed in the shitter with no paper to wipe with. Now you put Biden in there and expect him to curb the problem without spending a dime. Can’t be done! You need a Jubilee again. You need to eliminate all the debt and start from scratch. It will kick the hell out of the country but, it needs to be done. Then, maybe, responsible spending can once again happen.