


Gold Price Forecast: Shift in Trend Momentum
Today we turn attention back to weekly charts after looking at several monthly charts over the past few weeks (here and here). The weekly chart for gold caught our eye.
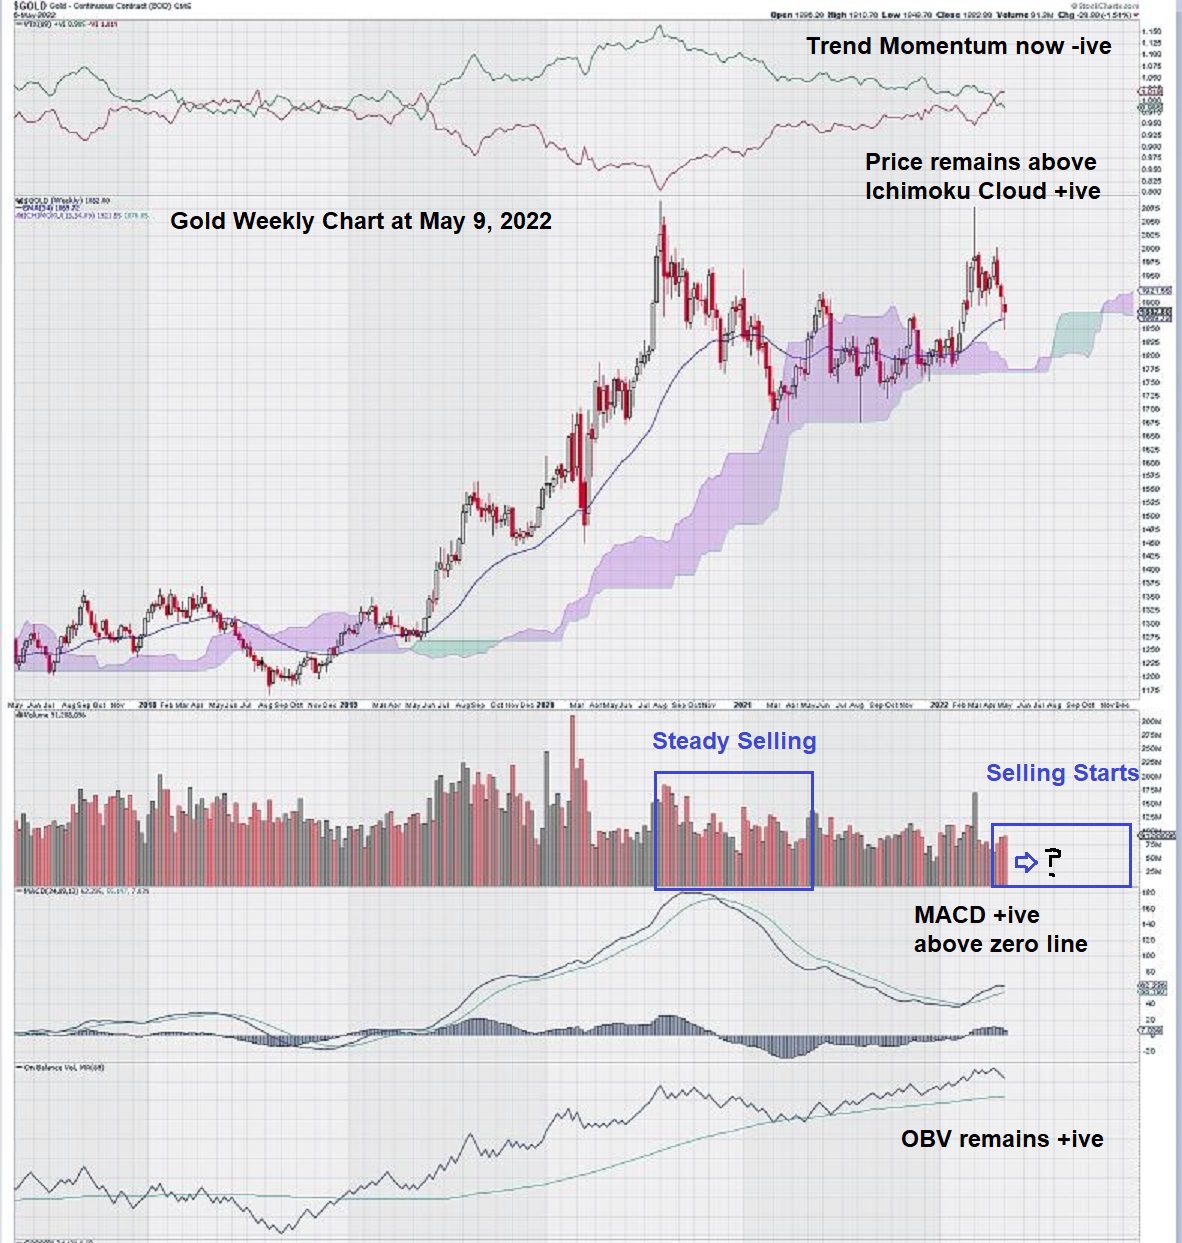
When trying to determine a gold price forecast, investors cannot ignore that trend momentum, which turned positive in May 2019 and has remained positive despite the pull-back in the gold price for most of 2020, became negative in mid-April.
This is a concern. Why?
When we look at this weekly chart, we notice that positive trend momentum has been on a steady decline since peaking in August 2020.
As you can see, negative trend momentum has taken over.
Yet…MACD remains positive with the signal line above the trigger line and both lines still above the zero line. Also, OBV remains above a long-term trigger line set at 89 weeks. In addition, volume has remained relatively light, even though it too is negative.
And finally, price remains above the Ichimoku Cloud – a good sign.
So, there you have it: a mixed bag of chart signals to try and sort out our gold price forecast.
Perhaps the candlestick chart itself can tell us something:
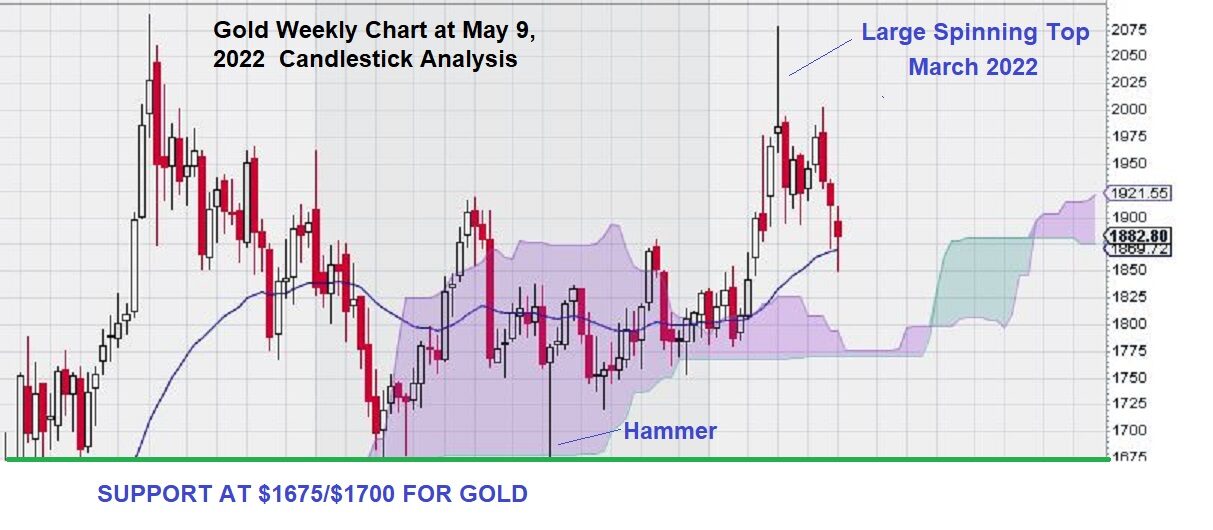
We see a large spinning top at the 1st week of March 2022. This marks the point at which investors had “maximum indecision” for gold.
The market was in the process of “choosing a direction.” The choices were to continue advancing or retreat. Staying in the same trading range was not an option.
Let’s take another look at the Candlestick chart and focus on what the chart is trying to tell us:
We see that after a wild week of trading in a very large range that gave way to a small real body (as shown by open and close for the week being almost the same), the gold price slipped a bit. Then, it re-rallied almost to the base of the Spinning Top small-real-body level and proceeded to decline. The decline took it through a key short-term support level at $1920.
Gold continues to show weakness in our gold price forecast.
Gold Price Forecast Summary
The weekly gold chart still remains positive on many fronts: OBV/MACD/Above Ichimoku Cloud. We see that longer-term trend momentum has slowly faded and changed from positive to negative. Our candlestick analysis was useful as it illustrates the large spinning top and keeps us focused on its significance.
Gold has established a strong support level at $1675/$1700, should it continue to decline to test that level.
In the meantime, we would prefer to see MACD remain above the zero line and for price to stay above the Ichimoku Cloud.
We have a particular interest in weekly volume going forward and prefer to see a mix of up and down volume for the weeks ahead rather than a steady diet of “red weekly volume bars.” That’s our gold price forecast for now. Let’s see what next week brings.
– John Top, the technical trader
Disclosure: We own gold and gold stocks.


Nice prediction about gold price. What’s your prediction of gold price for 2025?