Escaping a Multi-Year Trading Range or Ready to Retreat?
We haven’t talked about the US dollar chart since last year in December. But the US Dollar ($USD) is back in the news again. Today, we look at the US Dollar chart to answer the question: is the US dollar bullish?
Recently, the strength of the upward move has propelled it back up to a level that it knows all too well: 103.
This level put the brakes on the bullish US dollar twice in the past. Does anyone see a “three-peat”?
Let’s take a look at the weekly chart for the $USD:
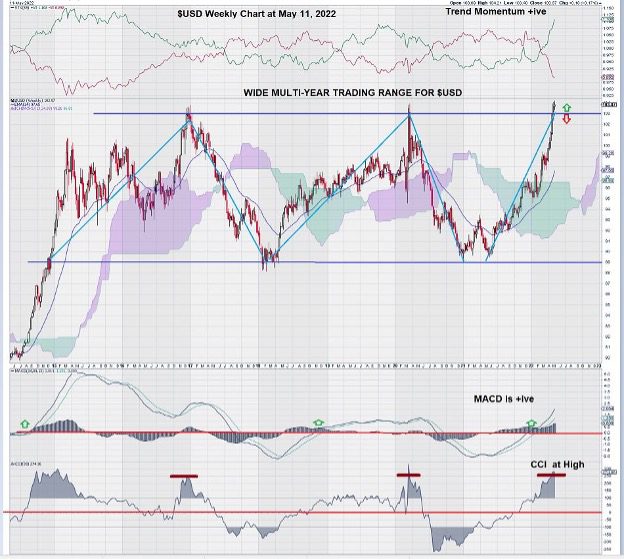
We can see that MACD was not the best indicator in the technical toolbox when analyzing the weekly chart for the US dollar.
It seems that CCI (Commodity Channel Index) is a far better choice.
CCI Shows a bullish USD
Note how it is very predictive for both the highs and the lows of the $USD in the multi-year trading range that we have identified. CCI has a well-established application when looking at commodities or currencies over the medium to long term.
This chart is very useful in another way. It shows how the price chart and its patterns complement the various technical indicators used.
For example, when evaluating the established trading range for the $USD, it would be a straightforward interpretation and conclusion to make a case for both a higher and a lower $USD. Currently, the $USD is at a key inflection point.
MACD is strong and above the zero-line, trend momentum has rocketed upwards, and CCI remains high. In other words, the US dollar looks quite strong, and it looks to move higher based only on the technical indicators.
The chart pattern tells a different story.
The wide, multi-year trading range for the US dollar conveys a note of caution. Twice in the past few years, we have been here before. Each time, the optimism of a further advance for the $USD was washed away, and a significant decline followed. Is this another one of those times?
In order to become bullish on the US dollar, the $USD has to break above this key level of 1.03; we would like to see additional weekly candlesticks that are much more encouraging than the ones we see so far. The last two candlesticks have been positive but weak.
Small spinning tops do not denote market conviction. Just the opposite. They are a sign of weakness and indecision.
Summary and Wrap-Up
Over the years, I have come to really appreciate the value of technical analysis. Just like the noise-canceling headphones that frequent flyers use, investors can become detached from all of the “market noise” and focus on what charts have to say.
Inflation, rate hikes, and other widely followed subjects that involve the economy have found their way onto the front pages of mainstream media. In a practical sense, this is the “market noise.”
Our strategy going forward is not to get swept up by the herd but rather to make our own way, relying on the technical analysis signposts to guide us headlong into a very uncertain financial future.
One parting thought: traders always find a way to win.
The weekly chart for the US dollar shows lots of trading room between 0.89 and 1.03 over the past few years. CCI was the “go-to technical indicator.”
There was (and is) a good opportunity to go long or short by simply following it.
– John Top, the technical trader