
Gold Price Chart Analysis for November 10, 2020
The Weekly Gold Chart
A few weeks ago, we took an in-depth look at the monthly gold chart. Our focus was to see how gold traded after JP Morgan agreed to a US$920 million settlement for manipulating the gold price over an eight-year period that ended in August 2016.
For those readers who want to refresh their recollections of this chart, follow the link provided:
https://www.equedia.com/gold-chart-analysis-post-manipulation/
Now, we turn our attention to a weekly gold chart.
Gold Price Chart Analysis: Gold and USD
In the past few weeks, there have been two events that may impact the way investors look at gold.
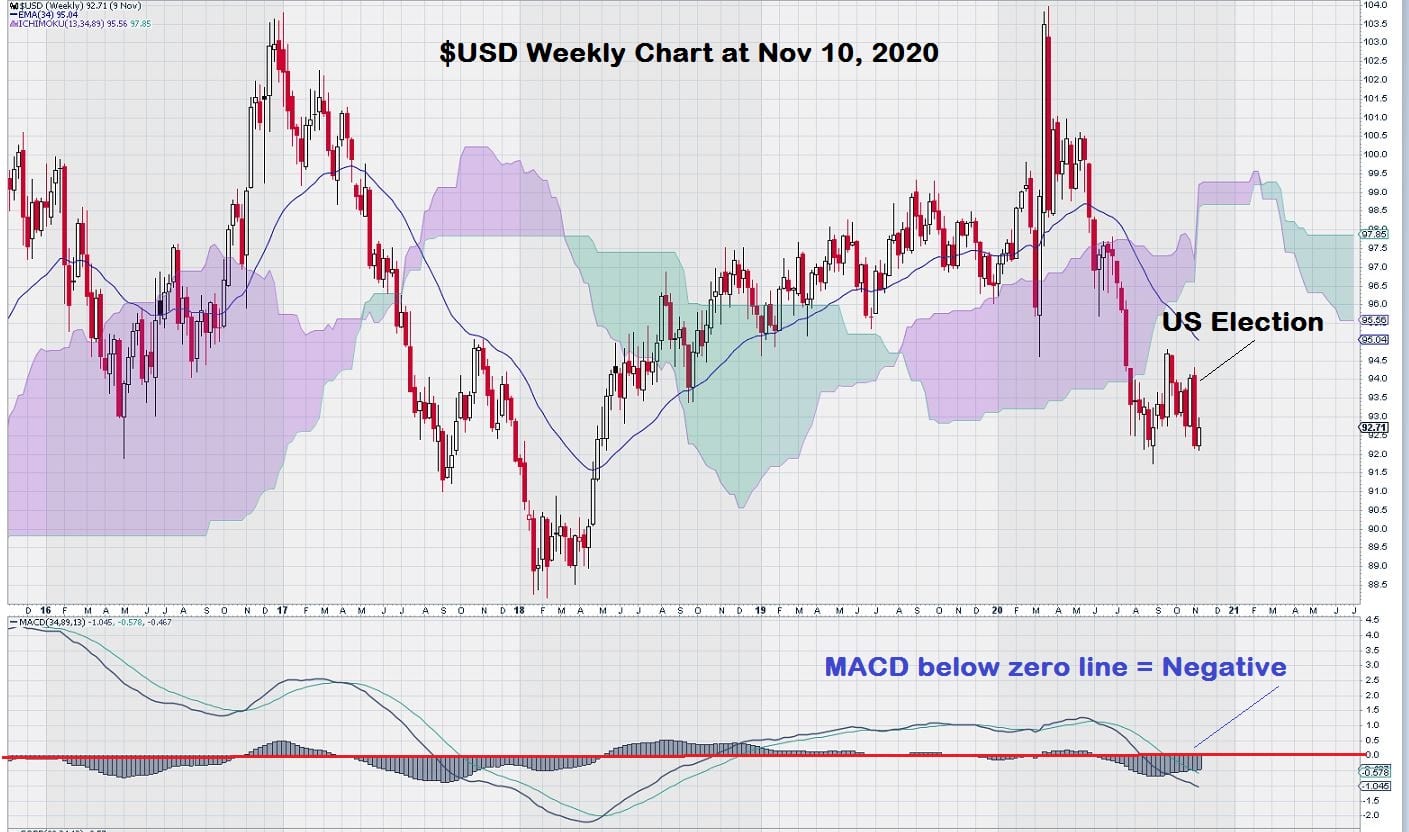
First, let’s take a quick look at the $USD weekly chart. It shows that the $USD is not in a favorable chart position. Why?
For two reasons: the signal line for MACD (using trend settings) is below the trigger line and, perhaps more importantly, both lines remain well under the zero line. This indicates a very negative condition.
Second, after the US election was deemed “over” by the mainstream media, the $USD had a very bad week, losing almost $0.015 for the week. This is a massive move down in the currency markets.
So how does the weekly gold chart look now?
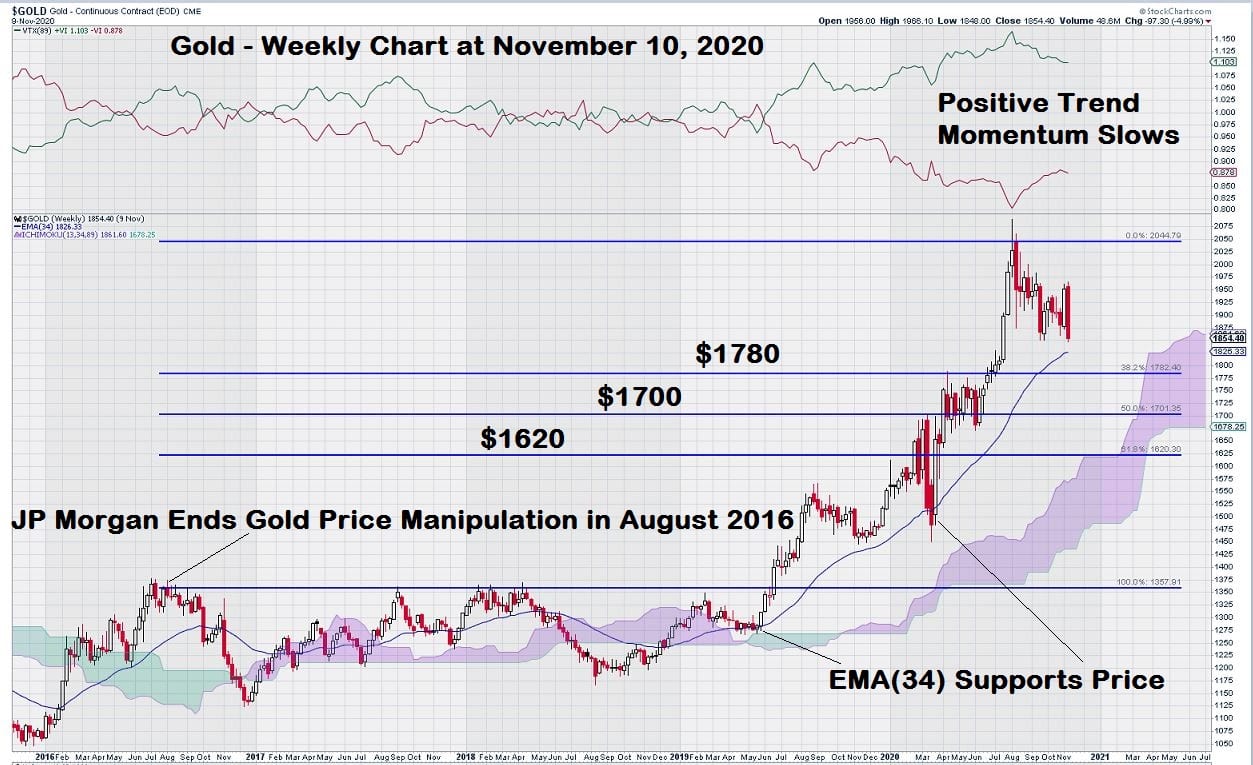
Here we see that gold has been well supported in the past when it tests its EMA(34) line. This moving average for gold on its weekly chart provided support in April/May 2019 and again in March 2020. We may see another test of support before the year-end.
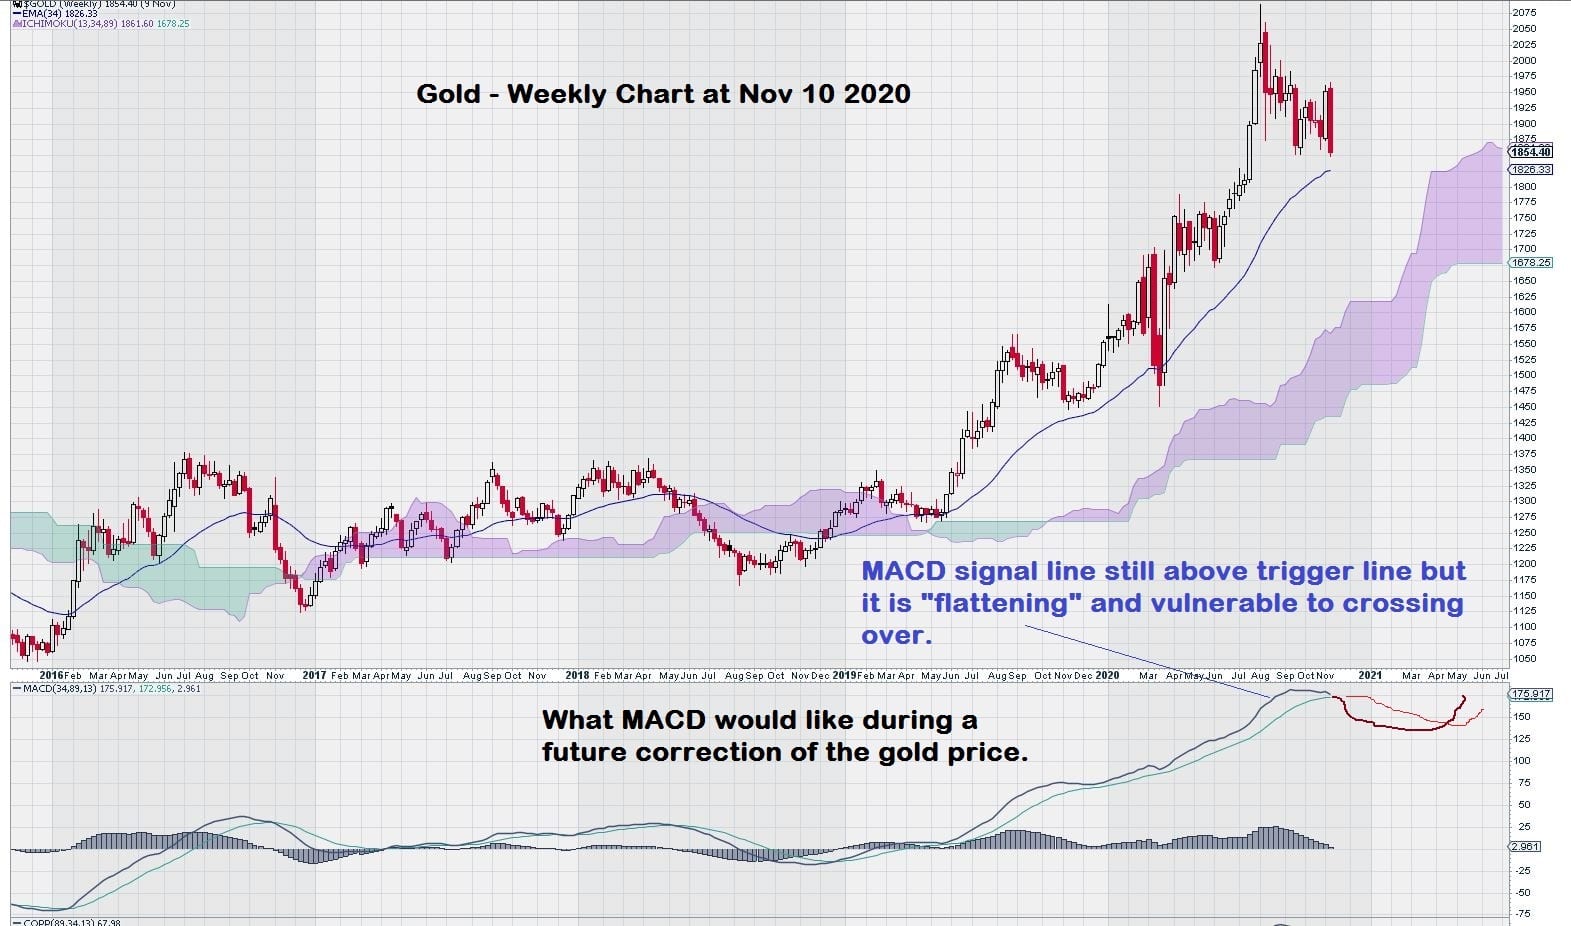
Another observation is that MACD has “flatlined” during the past few months during the decline from the recent high price. The signal line remains above the zero-line, and both lines remain above the zero-line, which is still positive. However, with the slow deterioration of trend momentum, it is possible that gold could enter a corrective phase.
What would this look like on a chart?
We will show a weekly chart for gold, with MACD marked up to reveal a possible future chart outcome based on a continued decline in the gold price, thus moving the signal line below the trigger line. The weekly gold chart has Fibonacci support at the levels noted: $1789/$1700/$1620.
Remember, these support levels were derived using the August 2016 gold price level as “zero.” This coincides with when the manipulation of the gold price was assumed to have stopped.
Summary & Wrap Up
Gold remains positively placed on the weekly chart, despite the decline to begin the current week. We have seen the signal line for MACD look “certain” to decline below the trigger line in the past. Still, after a week or two of stronger closes, the “trend in place” for gold remains intact, and the commodity/currency/equity will resume its trend direction.
Gold can easily sustain a decline that could take it down to around the $1700 level without significant chart damage. Sure, this would make some gold investors a bit “frayed around the edges,” but technical chartists would seize upon the opportunity to monitor the decline – looking at MACD for trade guidance.
What would that look like?
Look at the chart above. There are “three steps to a successful trade set-up”:
- Signal line below trigger-line
- Patience – for many, this is the most challenging step
- Signal line above trigger-line with both lines still above the zero line. Buy signal.
In the weeks and months ahead, we will keep referring to the weekly chart for gold – making the necessary comments and assessments along the way.
For the more adventurous traders/investors, the same logic for MACD holds for daily charts if you want to adopt a more aggressive trading posture.
-John Top