


What Happened to Gold Stocks After the Manipulation of the Gold Price Stopped?
TSX Gold Index Review
(Educational Segment 013)
At the end of September 2020, JP Morgan agreed to a record-breaking settlement of US$920 million that included a $436.4 million fine, $311.7 million in restitution, and more than $172 in disgorgement. The Commodities Futures Trading Commission imposed the fine, and the Department of Justice and Securities Exchange Commission will administer the restitution and disgorgement portions of the settlement. The settlement covered the period from March 2008 – August 2016 when its commodity and futures traders were found to be involved in a fraudulent trading practice known as “spoofing.”
This type of illicit trading had the effect of manipulating the price of various commodities, including gold.
Last week we took a long look at how gold behaved on weekly charts, focusing our attention on the time interval after August 2016.
Today, we will continue to examine the period after August 2016, but this time our focus will be on gold stocks as seen through the widely followed S & P TSX Global Gold Index (the “TSX Gold Index”).
We chose to look at monthly charts instead of our usual weekly chart observations because we wanted to use a very long “telescope” in terms of time.
Recognizing that gold, and by extension gold stocks, are “free at last” to trade on the basis of market forces, not under the influence of manipulation, makes us declare that August 2016 established a new era in the way that gold and gold stocks will trade in the future.
Let’s get started.
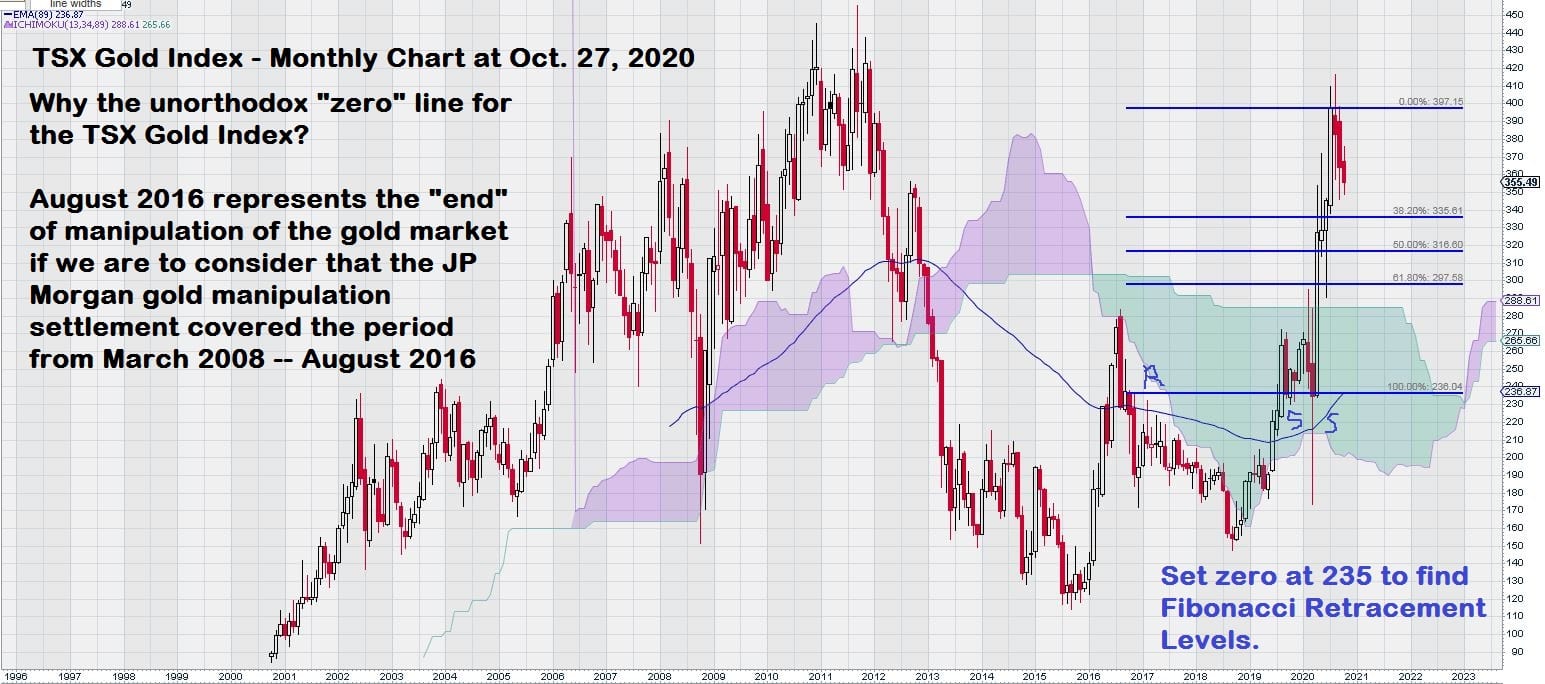
First, we note that the current monthly chart for the TSX Gold Index started a significant advance once it cleared the high close level for August 2016. Although a bit unorthodox, our premise for charting sets the “zero line” at this level. Thus, we see that the current Fibonacci Retracement levels range between 300/335. At the time of this writing, the TSX Gold Index is at 338.
We conclude that there is support in the 300/335 range of the chart, and it seems unlikely that further weakness in gold stocks will extend much below this Fibonacci defined level.
What if our analysis is proved wrong by time? Then what?
Charting is not an exact science – even though technical analysis relies heavily on math. After all, the basis for charts and their related patterns and indicators are simply manipulations of different periods of time or price. Successful use of charting by investors also means that one must always consider the “intangibles,”; those various factors that math can not capture.
For example, geopolitics/government policy/central bank actions/currency fluctuations/etc. all can have temporary impacts on the gold price, which impacts the pricing mechanism for gold stocks.
Perhaps we should define “temporary.” Temporary can mean to last for years. Gold investors already know this, and many have adjusted their timelines.
Some gold investors began as “traders” but have now have seen the wisdom of taking a much, much longer view. In other words, they are moving from being a shorter-term trader to a longer-term investor.
Having “out-waited” the long 6-year sideways price consolidation of gold, gold stock investors are glad they did. Once gold cleared the well established weekly resistance level of $1350/$1375, it marked the start of a significant price advance.
The TSX gold index chart is a very interesting study from the low in 2008 forward to today. Let’s recap what has already been noted in several weekly charts that have been posted on the EQUEDIA website (see “Waiting for the Golden Moment.“)
Are you a sharp-eyed investor? Did you catch the clue?
Exactly one year ago to the day is the date of the “Waiting for the Golden Moment” article.
I have a suggestion.
Take a deep breath, close your eyes for a moment, and then, with a clear mind, go back to one year ago and re-read the article. It will be instructive as we move forward with our discussion of gold stocks using the monthly chart.
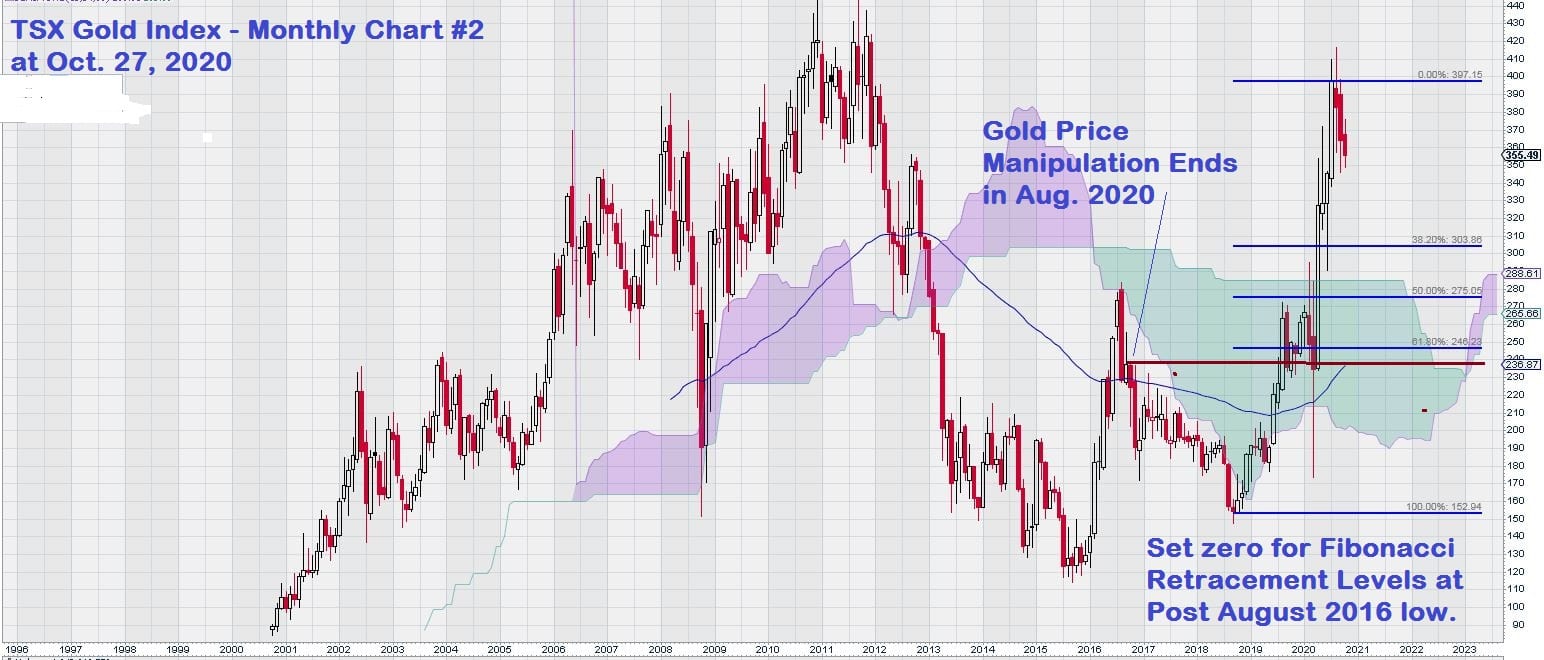
Perhaps a more conservative approach to chart construction is to move the zero line down to the post-August 2016 low. There is a good rationale for this approach.
Even though the manipulation of the gold price by JP Morgan stopped in August 2016, gold stocks continued to decline from the 235 level to a low of 150, reached in September/October 2019. It follows then that we should set our zero point for Fibonacci studies at this point. This lowers the Fibonacci support zone from the previous level of 300/335 to 300/245.
Obviously, the wider range is attributable to the greater distance between the lower low and the same high.
Here is Chart # 2 that illustrates the more conservative approach:
OK, so it is clear that gold stocks have support built into the monthly chart.
What are the other positive observations that one can make when analyzing this chart?
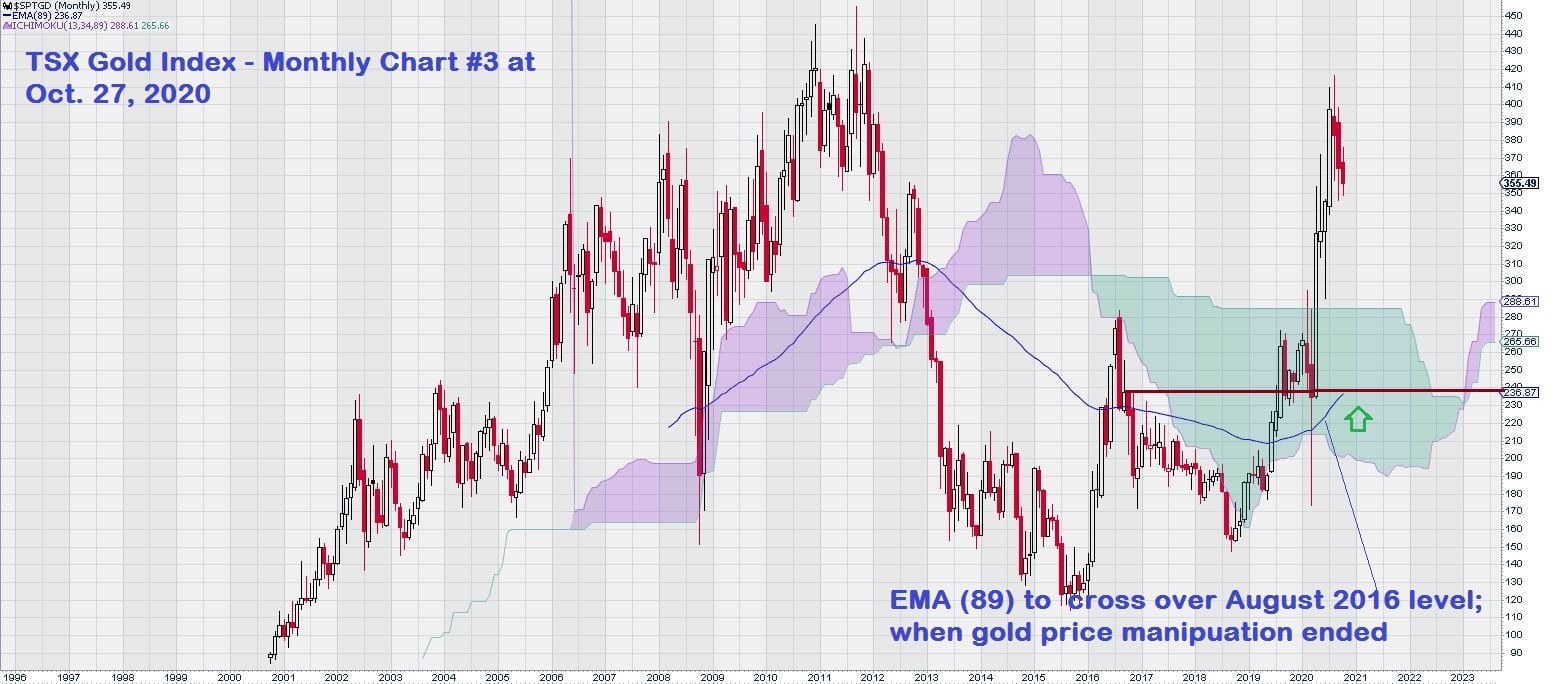
We will now take a look at the EMA (89); the 89-month exponential moving average:
Recall that one of the key guiding principles that we have seen repeatedly is the concept of two consecutive closes above or below a defined breakout/breakdown level. We strongly prefer to see the second consecutive close above/below the level with a stronger candlestick. Confirmation is a big part of how we approach technical analysis. Our concern is never to be “early” – it is to be “right.”
That is why we focus our charts on the time interval of weeks; and why we are being extra cautious and looking at these charts in terms of months when it comes to time.
Getting back to the chart shown, notice that the EMA (89) was crossed and re-crossed several times. In each instance, we need to focus on the 2nd and 3rd candlesticks and compare them to the first to determine whether the signal is valid or false.
Another key chart observation is that the EMA (89) is about to cross over the August 2016 closing level. This tells us that there is some internal momentum building in the gold index stock chart, even as it is now in a period of retracement from its recent high.
Finally, let’s just let our eyes glance over the chart to see if there is anything else worth noting. Sometimes what is visually obvious is so obvious that it is easy to miss. This might be the case here.
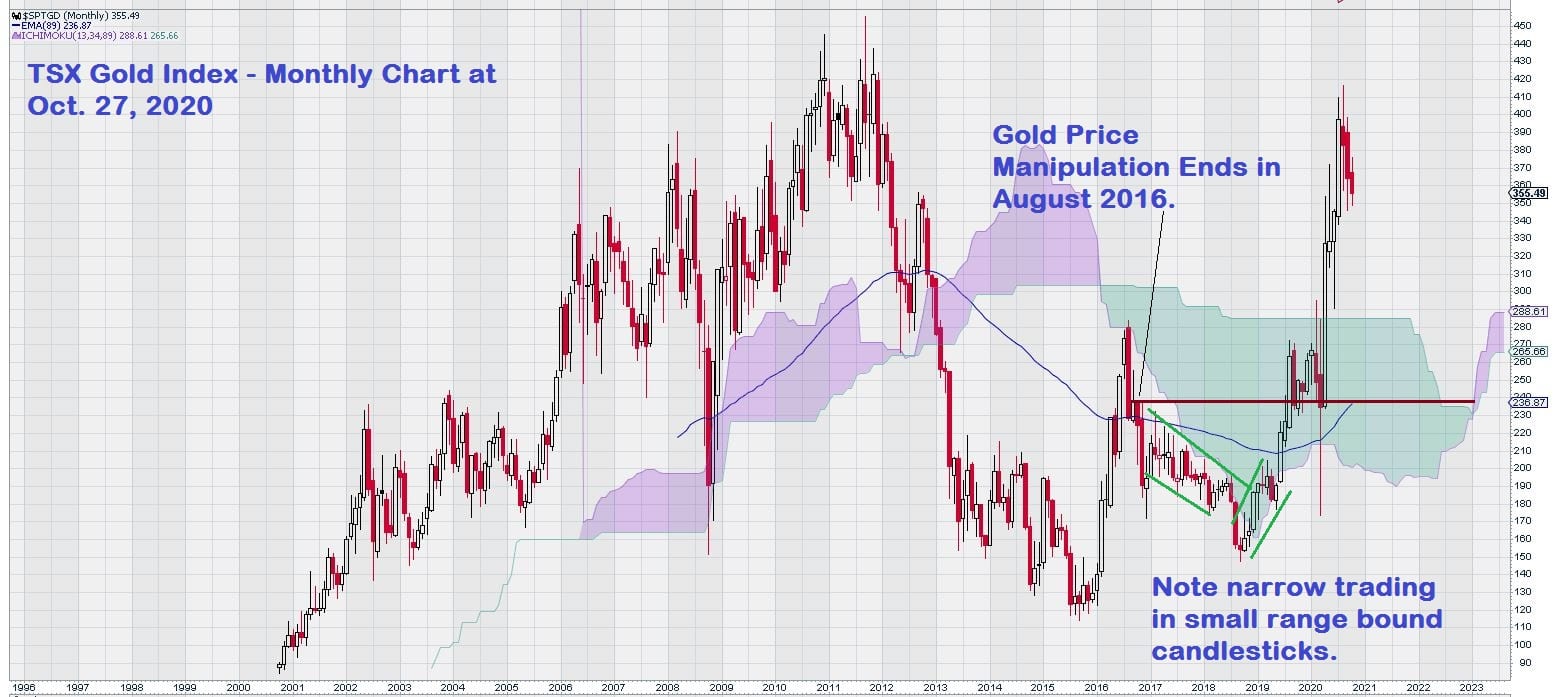
Do you see how “compressed” the trading in gold stocks became after the manipulation ceased? The mostly broad ranges suddenly shrunk as gold stocks fell, then recovered – all within a two year period. This indicates strong accumulation by powerful and sophisticated trading interests that were able to take on all of the weak-handed selling while being careful not to influence the price, especially in an upwards direction.
Once the weak-handed selling stopped, gold stocks traded up into 2019 to test the breakout level as defined by the August 2016 close. Later, in early 2020, even the impact of a market shock brought on by the COVID virus did not result in a meaningful decline below the August 2016 level on a monthly closing basis.
Still not convinced?
Let’s take a look “under” the chart at some of the indicators we use to help us with our technical analysis studies.
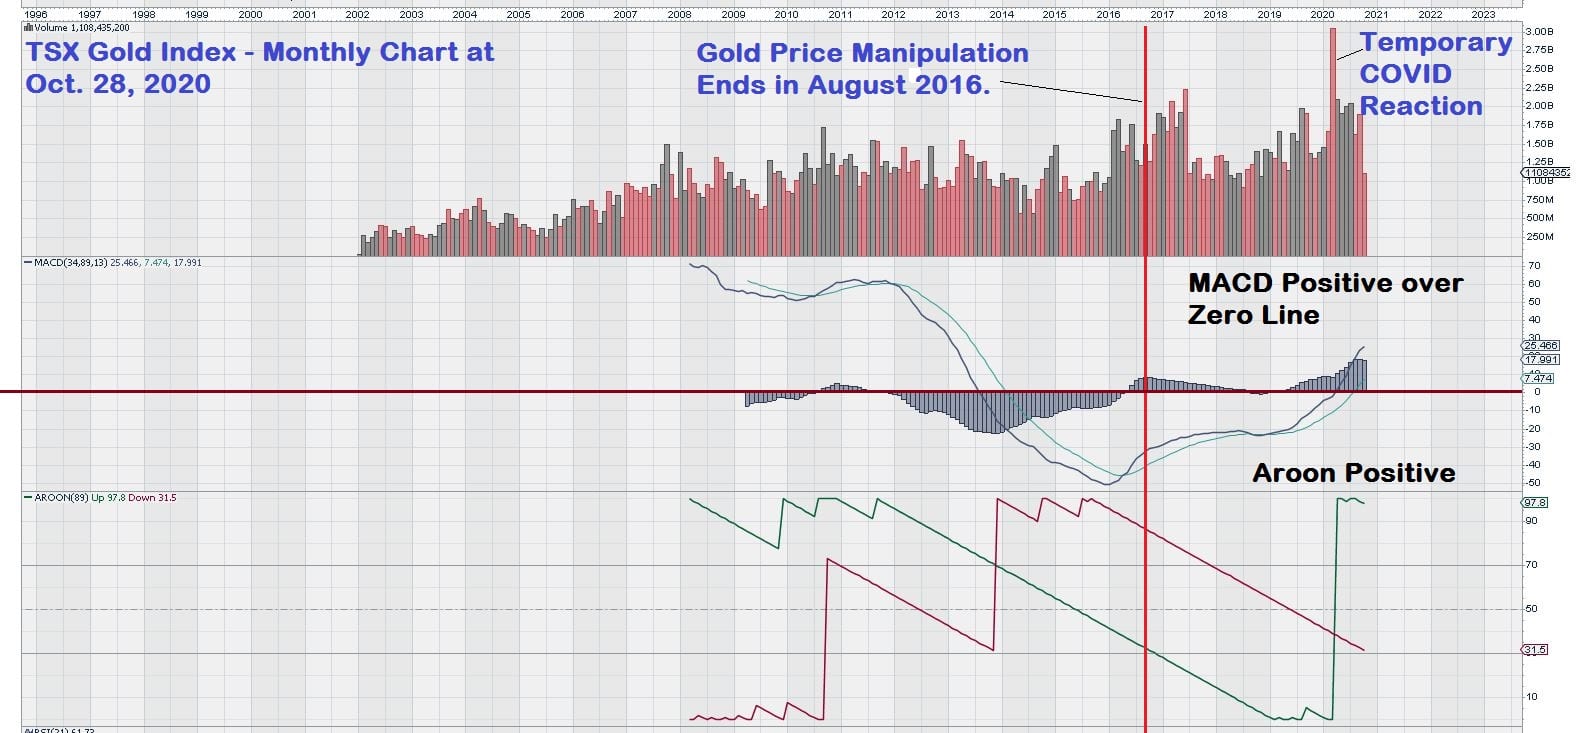
MACD, on very long term settings, shows a cross over of the signal line over the trigger line a few months before the August 2016 manipulation end date. Also, now, MACD is in a very positive position.
The signal line remains above the trigger line, and both lines are above the zero-line.
It is also instructive to note that the strongest selling month, due to the temporary COVID reaction, failed to impact the chart negatively. Several positive volume months immediately followed, resulting in strong gains for gold stocks and a new high from the previous lows in 2015 and 2018. Refer back to previous charts showing TSX Gold Index levels during these periods.
Summary and Wrap-up
We have taken the view that, for gold stocks, it is a new world. That world began in August 2016 when trading in gold was no longer manipulated.
Looking ahead, at a minimum, we would like to see at least 7 – 10 years of data that reflect a free trading gold and gold stock market, before there can be some valid trade signals – especially using Fibonacci retracements on both weekly and monthly charts. If these signals come sooner, we will be ready. If not, there is no reason to doubt both the strength and validity of this gold market, including the market for gold stocks.
Our premise is that declines in the gold price will lead to corresponding declines in the TSX Gold Index. These declines can be easily studied using standard technical analysis. We will rely on Fibonacci retracement levels to generate tradeable signals on both the weekly and monthly charts in the future.
And, speaking of the future, when the vast money printing by central banks finally comes home to roost in the form of inflation, a freely trading gold market will amplify the reasons to invest in gold stocks.
The market for gold stocks is analogous to a powerful racehorse stallion that has been kept in his stall for much, much too long. It will be exciting to see him stretch his legs on the racecourse and show us what he’s got.
I, for one, can’t wait.


great article