Dogecoin Chart Analysis: A Cautionary Tale on the Daily Chart
(Educational Segment 019)
Dogecoin does not have enough trading history to provide meaningful data on the weekly chart, so we chose to look at the daily chart instead.
The Dogecoin daily chart shares a similarity with the Bitcoin weekly chart – both charts show a “hockey-stick like” near vertical rise after a long, relatively flat base.
Here is what the Dogecoin daily chart looks like:
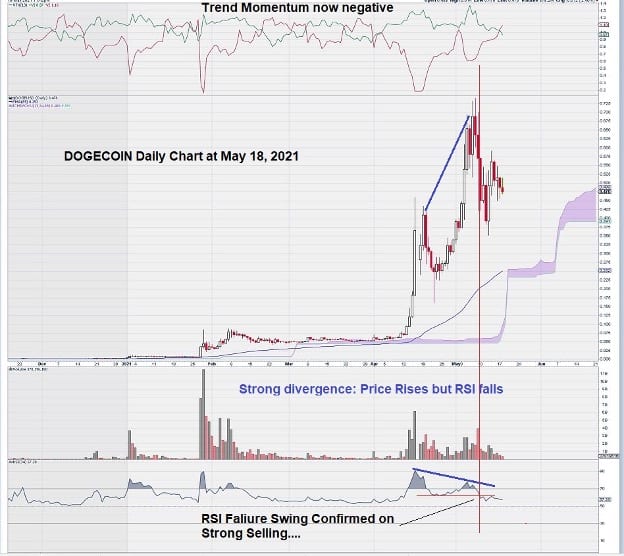
What catches the eye immediately is how we see strong divergence; price continues to rise sharply while at the same time RSI fails to keep up. Then, on a long, a volume-weighted red candlestick appears, signaling persistent selling pressure. This created what chartists sometimes refer to as an “RSI Failure Swing.”
Note what happens when the low level of RSI between the two highs is projected horizontally to the right-hand side of the graph. When RSI drops below this level, it completes the RSI Failure Swing Pattern.
Coincidently, this is where the most selling pressure for this part of the chart occurs: see the large red volume bar within the vertical red line on the chart.
Regular readers also know that we like to keep tabs on Trend Momentum in charts that we prepare. The indicator panel above the price chart shows that Trend Momentum has been positive since early April – now it is negative.
Now let’s take a look at the Fibonacci Retracements:
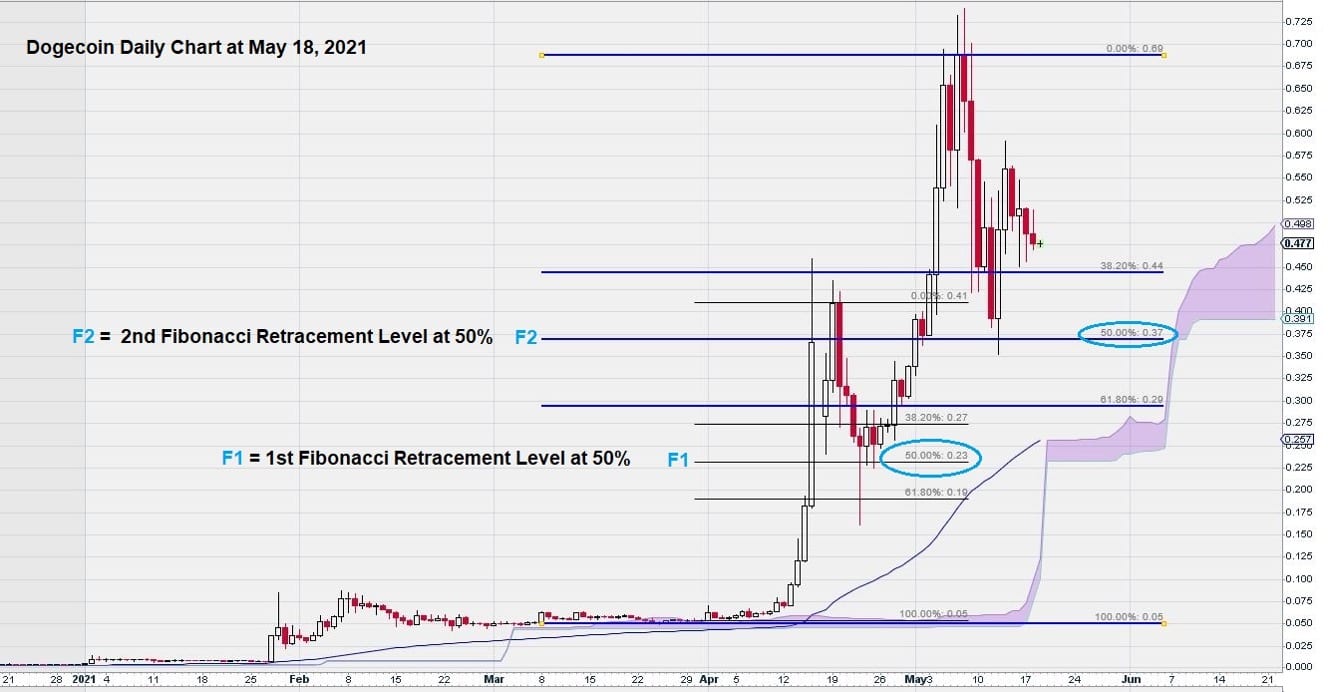
Here we can see that from the low to the first high on the chart, Dogecoin had a “normal correction” of almost 50% and then proceeded upwards. See the thin black lines on the chart.
A new all-time high was reached at $0.69 on a daily closing basis. Then, as we note, the price declined again by approximately 50%. Instead of making another new high, as it did previously upon breaking out, this time Dogecoin recovered to trade above the 1st Fibonacci Retracement Level of 38.2%, which corresponds to $0.44.
So, what to do if you’re looking to “trade” Dogecoin?
For a trade, we would like to see Dogecoin close above $0.56 before going long – this would be a level that could lead to higher prices.
If you are inclined to play short or are already long, then each Fibonacci Retracement Level could be its own Stop/Loss or Short Level. These are at $0.44/$0.37/$0.29. Currently, some of the technical indicators favor selling over buying.
As mentioned before, preparing this chart and the previous one on Bitcoin is regarded as a technical trading challenge – a curiosity of sorts. All that is possible is to provide technical commentary using standard methods of technical analysis and evaluation.
Summary & Wrap-Up
Regardless of what your views are on Dogecoin, Bitcoin, and other cryptocurrencies – good luck if you decide to trade them.
-John Top, the technical trader