A few weeks ago, someone asked me to take a look at the Bitcoin weekly chart. At that time, based on the weekly candlesticks, a “Stop/Loss” level of just over $58,000 was identified on the chart and suggested as a place to consider “lightening up.” I have not and do not intend to trade Bitcoin, so my views are completely derived from chart analysis—no “internal bias” in this corner.
Now, a few more weeks have passed, and Bitcoin has declined, so another quick look at the weekly chart seemed in order.
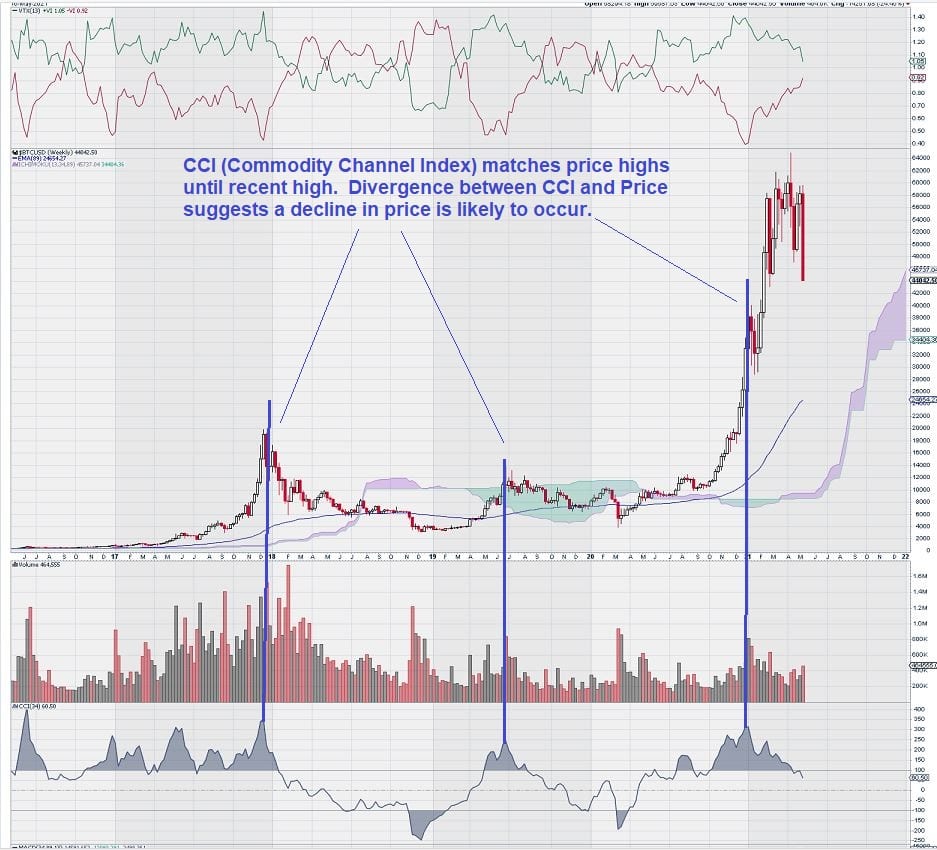
Here is how the CCI (Commodity Channel Index) gave a strong reason to be cautious and wary of a price decline once the price of Bitcoin advanced past $38,000. It is clear from the chart that divergence between price and CCI was something that speculators should have paid close attention to as the price continued to rise while CCI was falling.
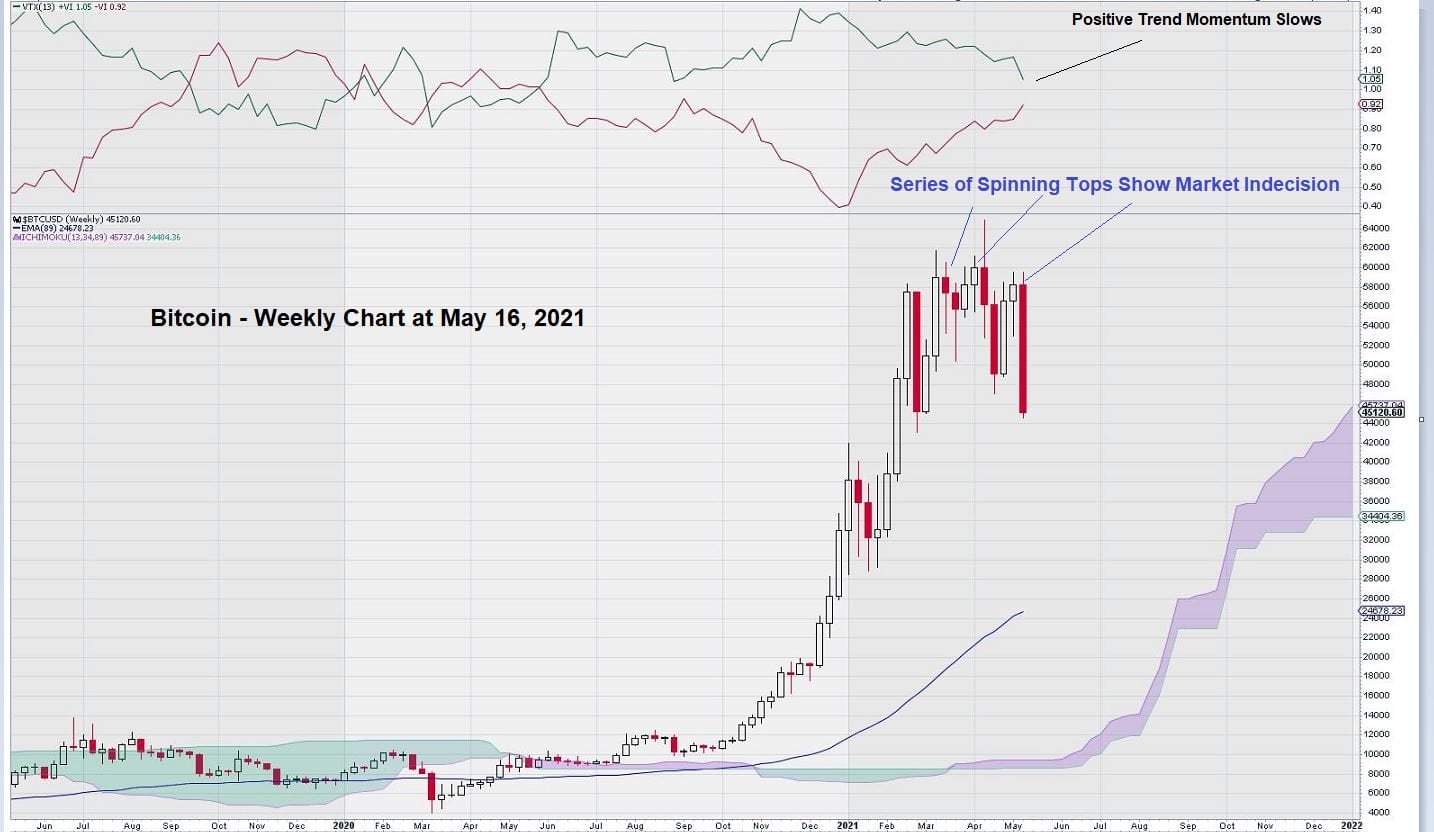
The weekly candlesticks for Bitcoin held their own clues about future price action. There were a series of spinning tops near a recent price high. Spinning Tops are signs of indecision in a market.
The Bitcoin weekly chart also shows resistance at $58,000 and at $60,000.
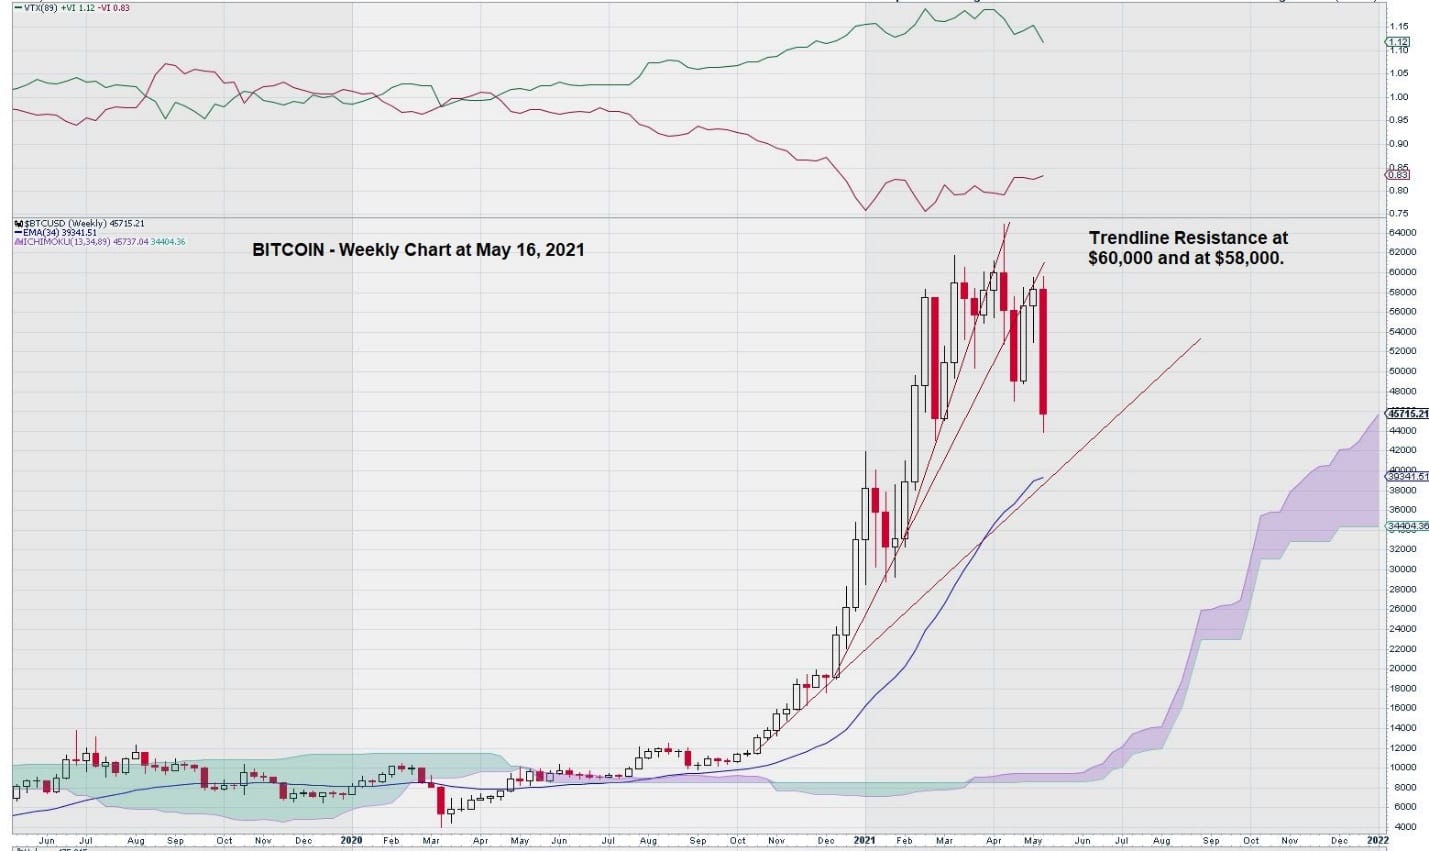
We did not provide a chart with the Fibonacci retracements. In an unorthodox manner, using $12,000 as a low and $60,000 as a high, the expected Fibonacci retracement levels are: $41,500/$35,800/$30,200. Note that the blue line under the chart represents the EMA (34).
Summary & Wrap-Up
The Bitcoin weekly chart seems responsive to using candlesticks as a means of analysis. It is elemental charting theory to be wary of spinning tops after a strong rise in price. This is exactly what the Bitcoin weekly chart demonstrated at around the $60,000 level.
The current trendline can be seen “tracking” EMA (34), and a break below this level would be significant. Let’s see what happens in the weeks and months ahead….
-John Top, the technical trader

Many of our readers have made more than $100,000
Subscribe to our FREE monthly newsletter and see how many of our readers have made thousands in PROFITS with our ideas