Tiny Bubbles Cause Big Troubles for Excelsior – Or Do They Provide an Opportunity for Speculators to Profit?
The first time you hear Don Ho sing, “Tiny Bubbles,” just as the song says, you “start to feel happy, start to feel fine” as you reminisce about pleasant times in the past.
This is most certainly not the case at the executive offices of Excelsior Mining Corp. (TSX: MIN) (OTCQX: EXMGF) (FSE: 3XS).
They wish that their tiny bubbles would just go away.
Today, MIN released a short press release that led with …”management is unaware of any material change in the Company’s operations that would account for the recent trading activity in the Company’s stock.”
We have been following the development of MIN for quite some time. The Company has had to overcome several challenges. Initially, there was uncertainty about receiving a Federal EPA Permit during the permitting phase back in 2017/2018. This was successfully resolved, and a permit was granted.
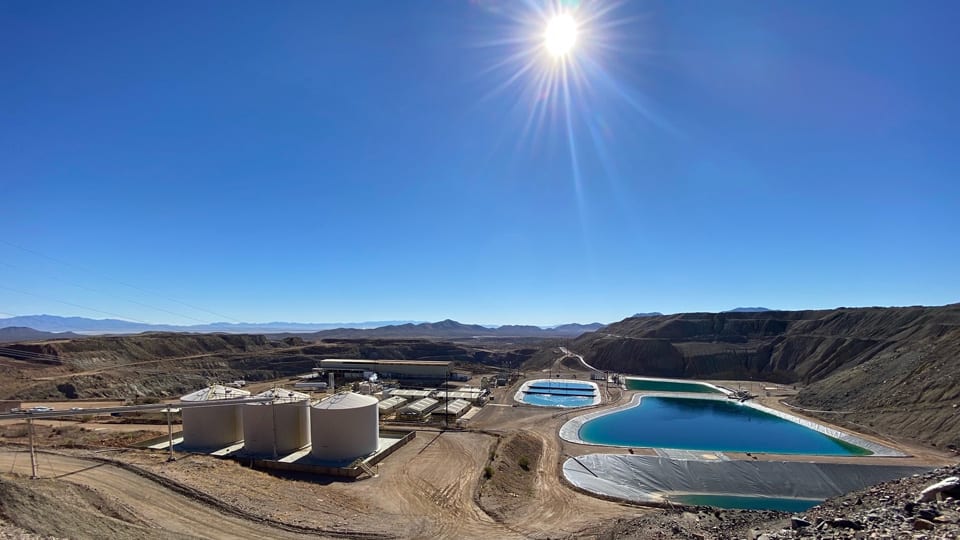
A wellfield was installed during 2019, and it looked like MIN was set to commence initial production from their “in-situ” copper leaching operation located 65 miles southeast of Tucson, Arizona.
2020 was spent learning how to operate the well-field system to recover copper from the vast measured and indicated resources totaling 4.99 billion pounds. The Company studied various flow rates and carefully monitored the solution recovered for its copper content. Near the end of the year, there was enough copper in solution to process it in through the electrolytic cells. On December 21, MIN announced the production of their first copper cathode.
This brings us to 2021. On February 10, MIN announced a $20 million bought deal consisting of a share at $0.95 and a warrant at $1.25, good for 18 months after completion of the financing. Due to the strength of the copper market, strong demand for the financing bumped it up to $28 million, and it closed on February 22.
So, what was our take on MIN as a possible investment as 2020 came to a close?
Here is a link to our past articles:
https://www.equedia.com/excelsior-mining-shares-responding-a-look-at-the-technical-stock-chart/
https://www.equedia.com/excelsior-mining-the-daily-chart/
We summarized the situation like this:
“We see positive indications on the daily chart for MIN.TO that will take time to be reflected in the weekly chart. The shares are at a key breakout level. We look for positive news from the Company that will reassure investors that the vast copper resource that sits just below the surface can be profitably extracted using the in-situ leaching method.
Once this happens, a very positive re-rating will occur.
One gets the sense that institutional investors are just waiting in the wings for the green light to invest in size. The stock is ready, and the pump is primed – now management must deliver the goods.”
The stock chart for MIN shows what happened next.
The stock chart is reflecting great uncertainty in the minds of investors who understand the value proposition in MIN shares. As we pointed out in our previous article – “…now management must deliver the goods.”
So far, they have not.
OK. What’s next?
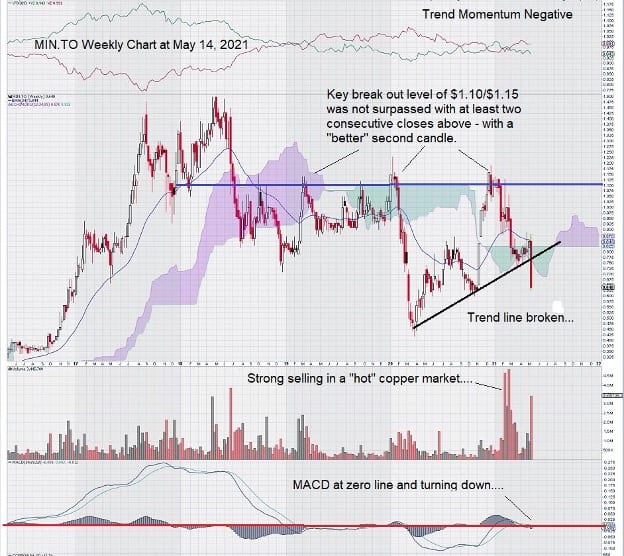
This chart and the ones that preceded it show the true value of technical analysis. Weekly charts, in particular, seem better suited for defining important levels within charts. The target level of $1.10/$1.15 was met several times, but the stock could not push through it on a sustained basis.
We clearly understand where the value is in MIN shares. The risk is can management deliver success in the form of sustained, profitable well-head production? Can they solve this technical problem of entrained gas (Carbon Dioxide) in the form of “tiny bubbles”?
The bubbles exist because there is a small amount of calcite mixed in with the rocks that host the copper deposit. Here is a look at what that means when sulfuric acid and calcite mix:
CaCO3CaCO3 + H2SO4→CaSO4H2SO4→CaSO4 + CO2+H2O
There they are, those tiny bubbles, in the form of carbon dioxide. The bubbles are causing a reduced flow rate which is negatively impacting copper production.
Solving the “gas bubble problem” could be as simple as implementing a secondary step, i.e. “rinsing the gas bubbles” periodically, or it could be a much more difficult process to recover all that copper from the highly fractured rock that lies beneath the surface.
MIN now has more downside risk than it did in the past.
The market recognizes this risk and has adjusted the share price and market capitalization accordingly.
Speculators can key in on MIN in two ways.
The first is through fundamental analysis – keeping in close contact with Company to monitor progress as the Company works through its technical challenges. The second is through technical analysis – trend momentum is negative, and so is MACD.
The short-term chart has broken its trendline. These indicators could signal that problems have been solved if and when they turn back up.
If you are an investor who is good at analyzing risk, then perhaps MIN is for you. MIN is currently a speculation that could easily turn into a great investment…if only those tiny bubbles would go away!
-John Top, the technical trader