Blue Monday and Happy Friday for Gold After a $100 Round Trip
Last week, gold investors breathed a big sigh of relief as trading antics in the “off hours” resulted in a so-called “mini flash crash.” For the week, gold essentially took a $100 round-trip. First, it traded from around its current level down to $1675 and then recovered it all back by the end of the week. Today, gold is trading at $1790.
Here is a weekly chart that shows gold’s $100 round trip graphically in the form of a very long lower shadow on the candlestick that represents the large trading range for last week:
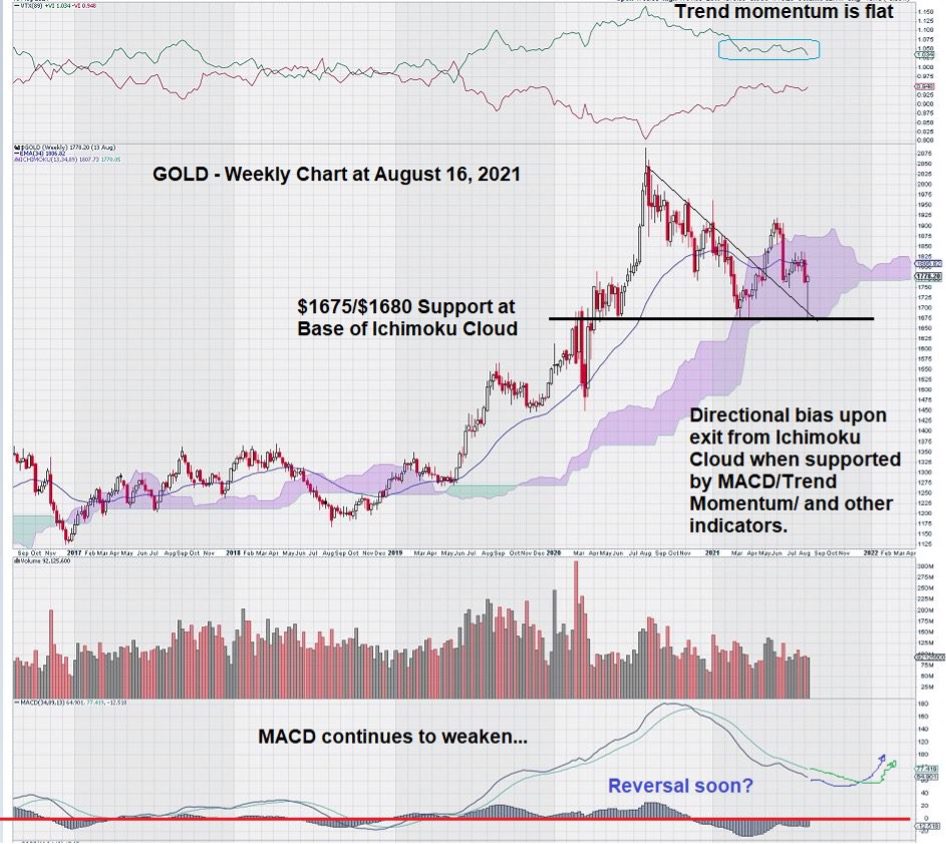
The weekly chart for gold clearly shows good support at the base of the Ichimoku Cloud at $1675/$1680. We see that MACD is in decline after it crossed over in November 2020. For gold to resume another attempt at trading above $2050, it is necessary for MACD to cross over and become positive, with the signal line above the trigger line.
It also would be preferable to see this future cross-over of MACD, if it occurs, to take place above the zero line as shown on the chart.
Trend momentum is still positive but essentially “flat.”
The gold price is now at a very clear position on the weekly chart with respect to the price chart and the Ichimoku Cloud. The concern we have is better illustrated by stepping back and using a 14-year chart instead of one that only looks back five years.
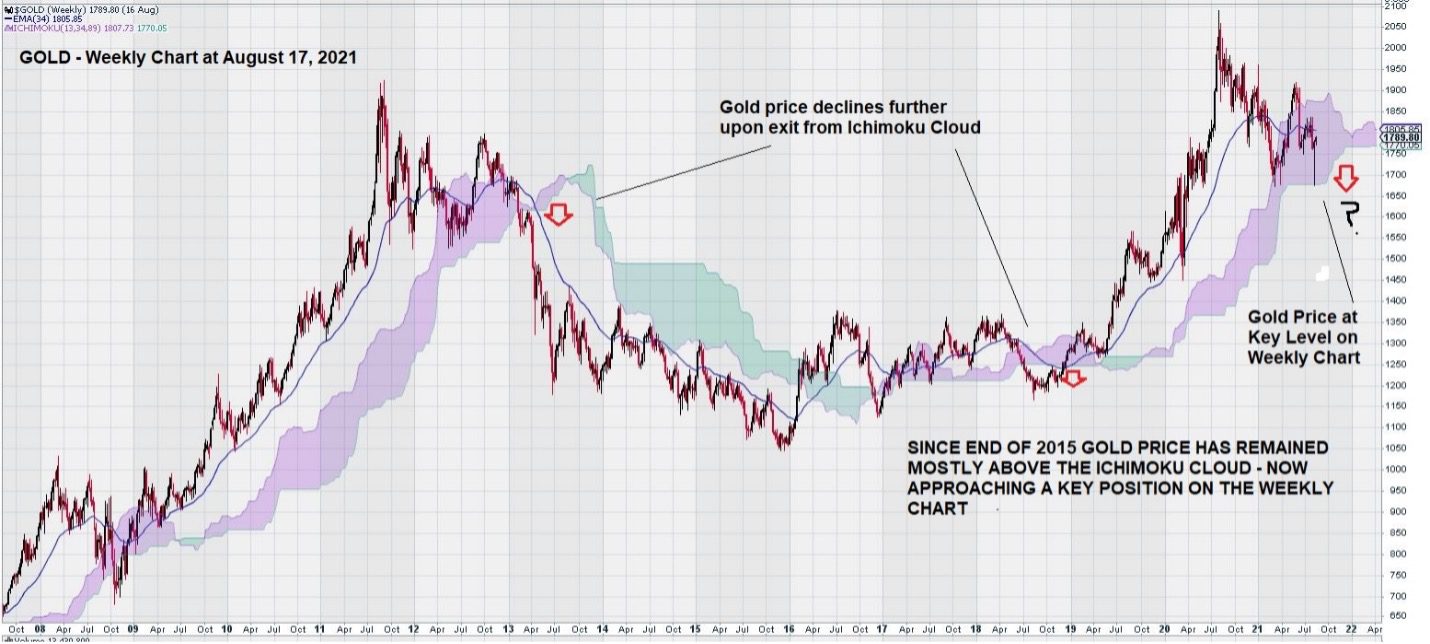
Here we see a robust and steady run-up of the gold price from a low in 2008 to a peak in 2011. This was followed by the gold price declining and spending 2012 within the Ichimoku Cloud. Then, early in 2013, price exited the Ichimoku Cloud, and a long, multi-year decline followed.
We note the similarity of the weekly chart pattern between then and now.
For this reason, our eyes are not going to drift far from the weekly gold chart as we continue to close out 2021 and enter 2022.
Summary and Wrap-Up
Many factors help to determine the gold price.
The weekly gold price consolidates all of these factors into a single point: the Friday close. A few weeks ago, we saw a big gap between the open and close for gold during a one-week interval. This is because the weekly chart does not concern itself with the “journey,” but rather it looks at the “destination.”
Previously we presented an odd-looking chart in which we selected a point above the low (we chose $1350 over $1050) because we wanted to study the interval of time that gold traded after breaking out from a level that had kept it in check for six years. If we take a Fibonacci retracement from the low ($1350) to the high ($2050), we see that a 50% retracement is at the lower level of the Ichimoku Cloud that we are currently watching at $1680.
Should gold decline below $1680 and continue to decline, we will go back to a more standard Fibonacci analysis and use $1050 as our low and $2050 as the high.
-John Top, the technical trader