
Cry of the Wolf!
(Educational Segment 016)
Let me begin by wishing our readership the very best in 2021.
There is a growing consensus that commodities will become more into focus for investors as this year is seen as a “re-start” of the global economic engine. What this will mean is lots of investment opportunities in the year ahead and even more trading opportunities.
In a bit of a departure from our weekly charts that we highlighted in 2020, this year, we will present more daily charts.
Weekly charts are great for patient investors who want to “get it right” as far as trends and, more particularly, as far as trend changes are concerned.
Daily charts, on the other hand, are much more sensitive to change and provide better clues “in real-time.”
Even so, our more extended, non-standard settings that we use on our daily charts are designed to filter out as much short-term “noise” as possible to prevent what traders like to refer to as “whip-saws” or “false break-outs.”
So, with that in mind, let’s begin the year by taking another look at Wolfden Resources Corporation (TSXV: WLF). You may recall that we wrote about WLF.V in July 2020.
https://www.equedia.com/could-wolfden-be-on-the-verge-of-a-big-discovery/
At that time, what caught our attention was the expansion drilling program at the Pickett Mountain polymetallic project in Maine.
Let’s go back and look at the weekly chart in July 2020, and then we will compare it to the weekly chart in January 2021.
WLF.V Weekly Chart – July 2020
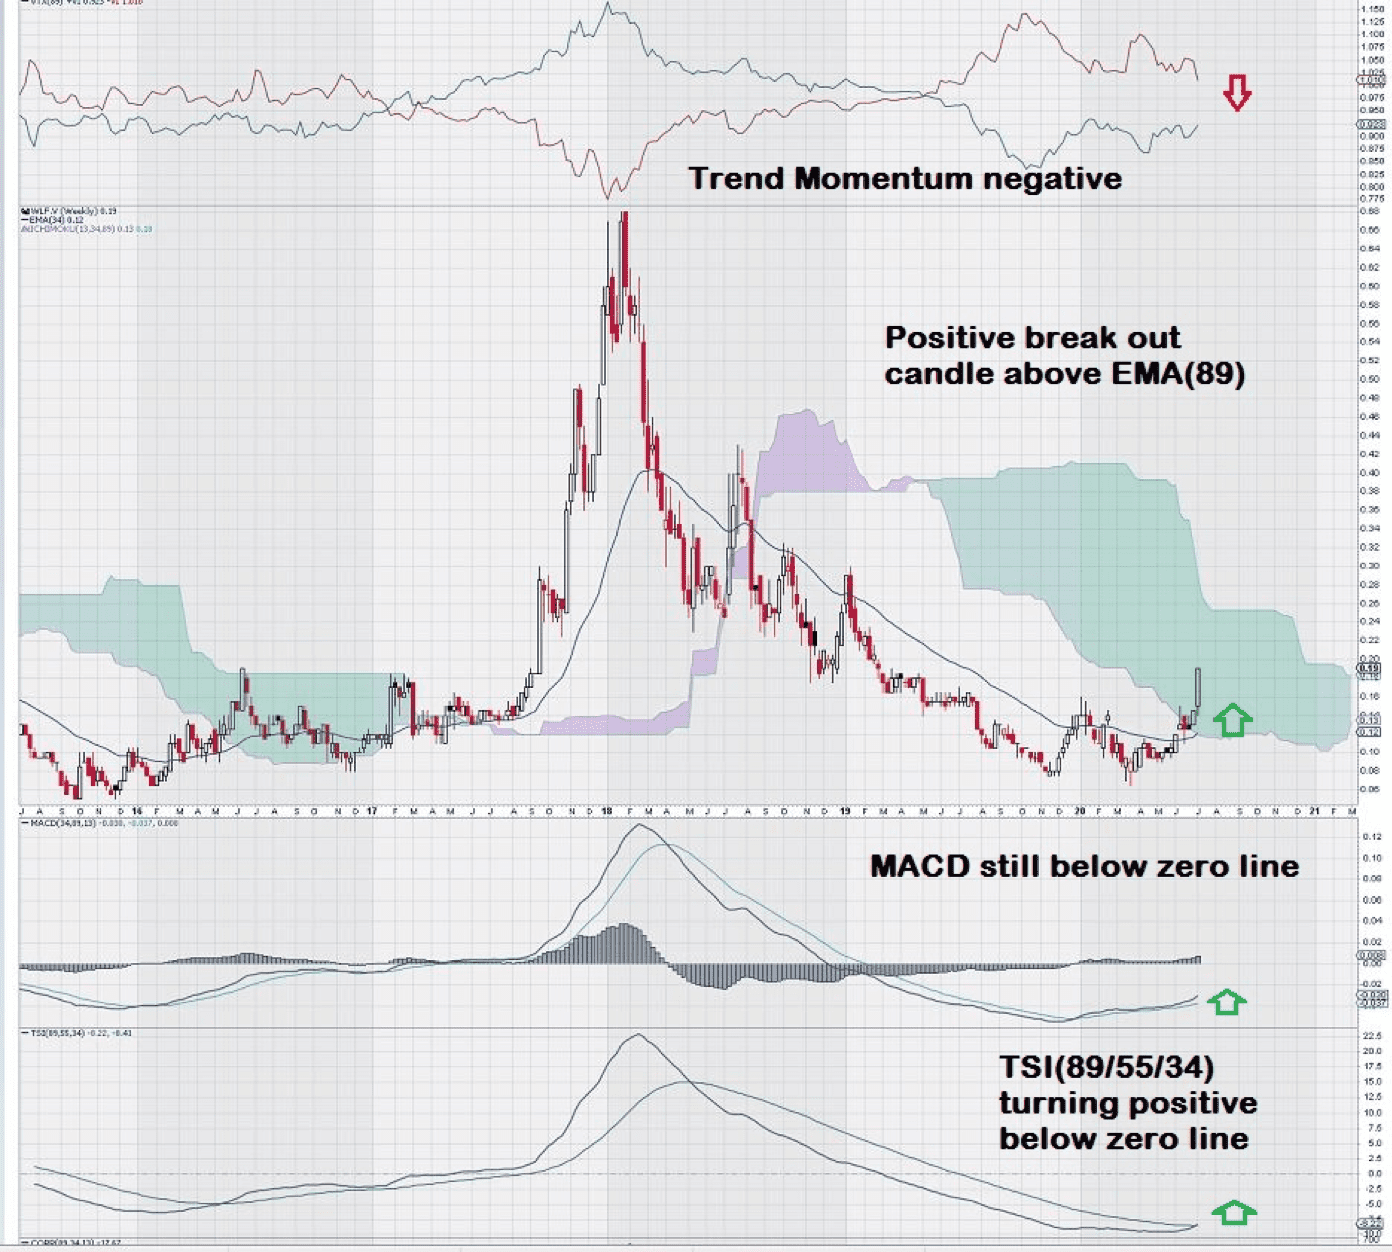
As you can see, the weekly chart for WLF.V was making what we thought looked like a “bottoming turn.” There were still some negative attributes of the chart, such as TSI below the trigger line and below the zero line (TSI is a long-term trend indicator based upon a triple smoothing of exponential moving averages); MACD was above the trigger line and moving in a positive direction but only slightly so and it still remained well below the zero line; price had entered the Ichimoku Cloud but remained below it and, finally, trend momentum, as measured by the Vortex Indicator remained negative. The one bright spot: price had just risen above the EMA (89) line.
In summary, other than the positive cross over of the EMA (89), there was not much other technical support for the chart.
But, recall that we also highlighted the details of a non-dilutive financing arrangement that WLF.V had made with a timber company that was going to be providing the company with $USD 4.5 million in exchange for the right to harvest timber from the property.
Remember, too, that 2020 was a year fraught with uncertainty due to concerns about how the virus was crippling the global economy.
Despite good fundamental news regarding the financing and some promising drill results early in the year that indicated more potential for discovery, the shares languished until the decision was made to proceed further with exploration.
Now, let’s turn the clock ahead to today and see how much the weekly chart has improved.
WLF.V Weekly Chart – January 2020
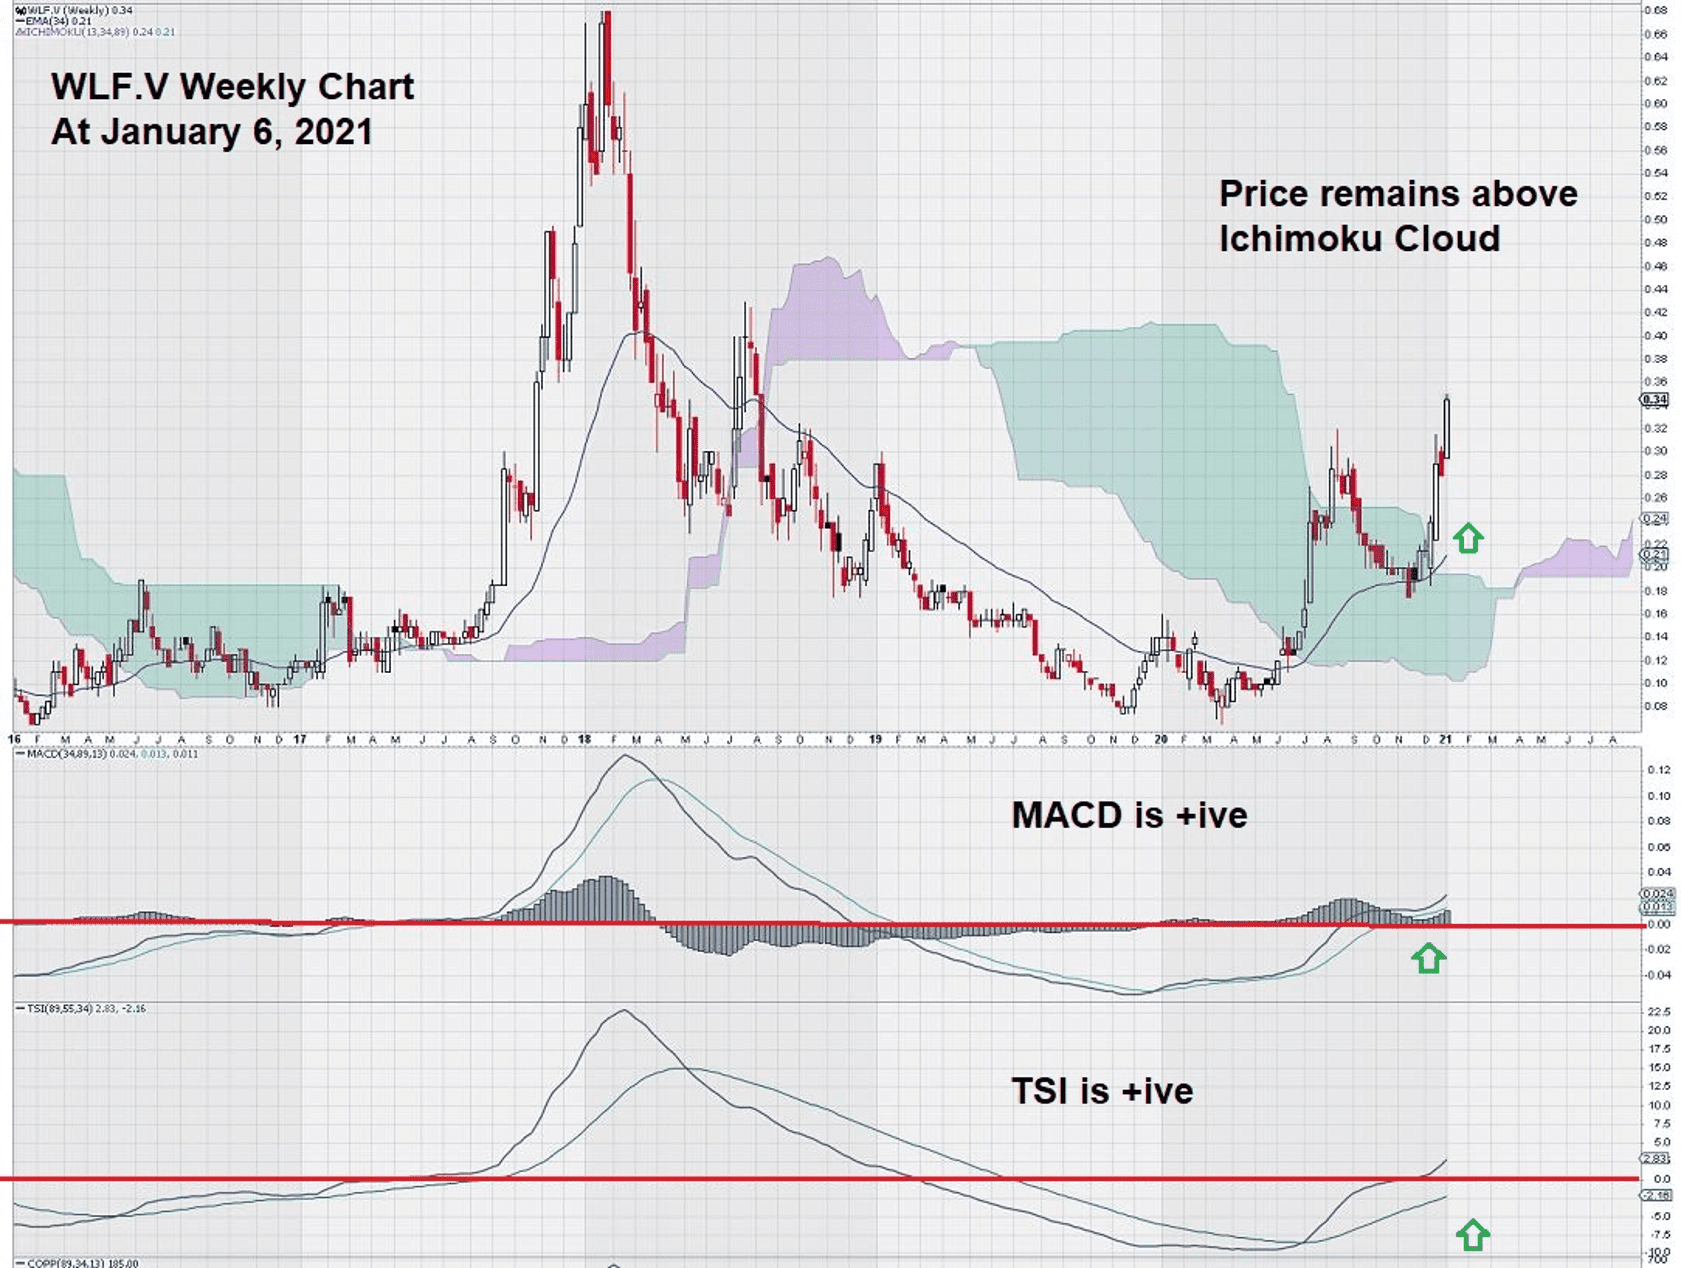
Here we see that both MACD and TSI have turned up and over the zero line, and both have the signal line above the trigger line.
Also, we note that the price has risen above the Ichimoku Cloud. Another interesting technical observation is that the EMA (89) line, though breached for a one-week period in November 2020, provided support at the $0.20 level. Not shown on the current weekly chart is VTX (89), and it, too, is now positive.
Here is a look at the daily chart.
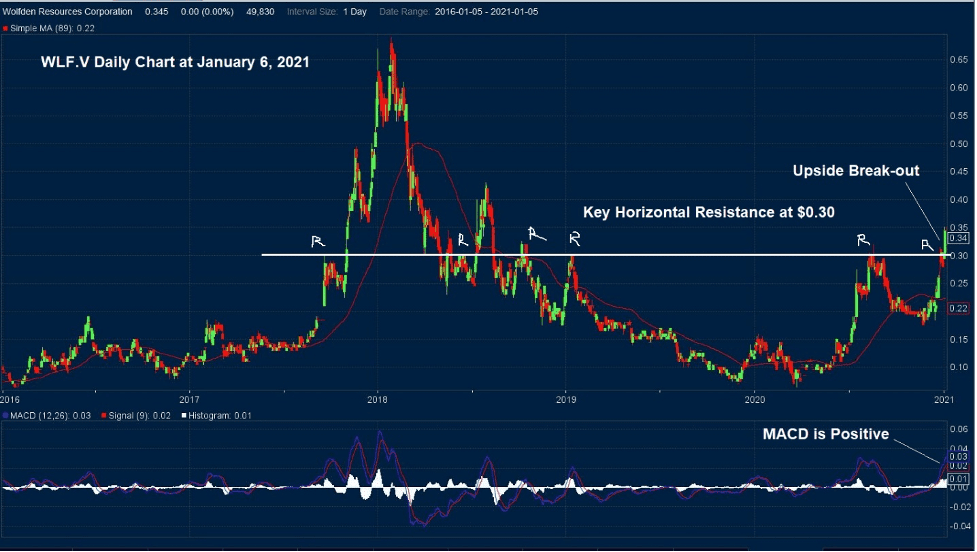
This chart is very timely.
WLF.V is currently making successive new 52-week highs. The stock is breaking over a key horizontal support level at $0.30 – one that stretches all the way back to 2017. It would not be chart negative for a re-test of this level from above. In a chart such as this, when a long and well-established level of overhead resistance is finally broken, it could be the start of much better things to come.
Another way of looking at the daily chart is to recognize chart patterns. Here we see one of my favorite chart patterns, the tea-cup with handle pattern.
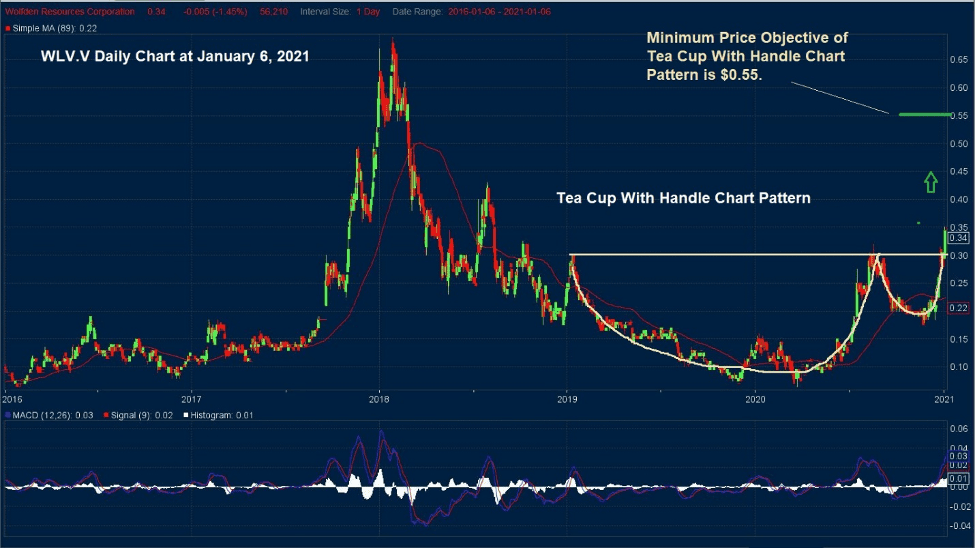
The tea-cup with handle pattern has a simple minimum price objective that is easily calculated. It is simply the height of the cup added to its top. In this case, that would suggest a minimum price objective of $0.55.
Summary and Re-cap
WLF.V is making new 52-week highs and is breaking through a well-defined overhead resistance level. This level has been tested several times in the past, and it has previously repelled price lower. This week, it did not.
We don’t want to speculate why there is a desire to “pay up” for the shares. However, it is worth noting that the December 2020 press release disclosed that:
“The final three holes PM20-15, 16 and 17 of the recently completed drill program intersected new zones of massive, semi-massive and stringer sulphide mineralization that occurs 200 metres north of and parallel to the West Lens resource. The area north of the West and East Lenses is referred to as the footwall. Although sampling and assays are pending, a portable XRF (Niton) analyzer indicates the massive sulphides are enriched in zinc and silver and may represent significant potential to increase the overall resources on the property.”
The press release also goes on to say that results will be available in the coming weeks.
WLF.V continues to make good progress in advancing its high-grade Pickett Mountain polymetallic project. The company is well funded and well managed. It appears to be a good speculative vehicle to have some exposure to at a time when there is renewed investor appetite for commodity-related equities.
-John Top