Another Ascending Triangle Pattern – Another Predictable Result
(Educational Segment 20)
One of the pitfalls of technical analysis is what I would like to call “pattern saturation.” What do I mean by this? Let me explain.
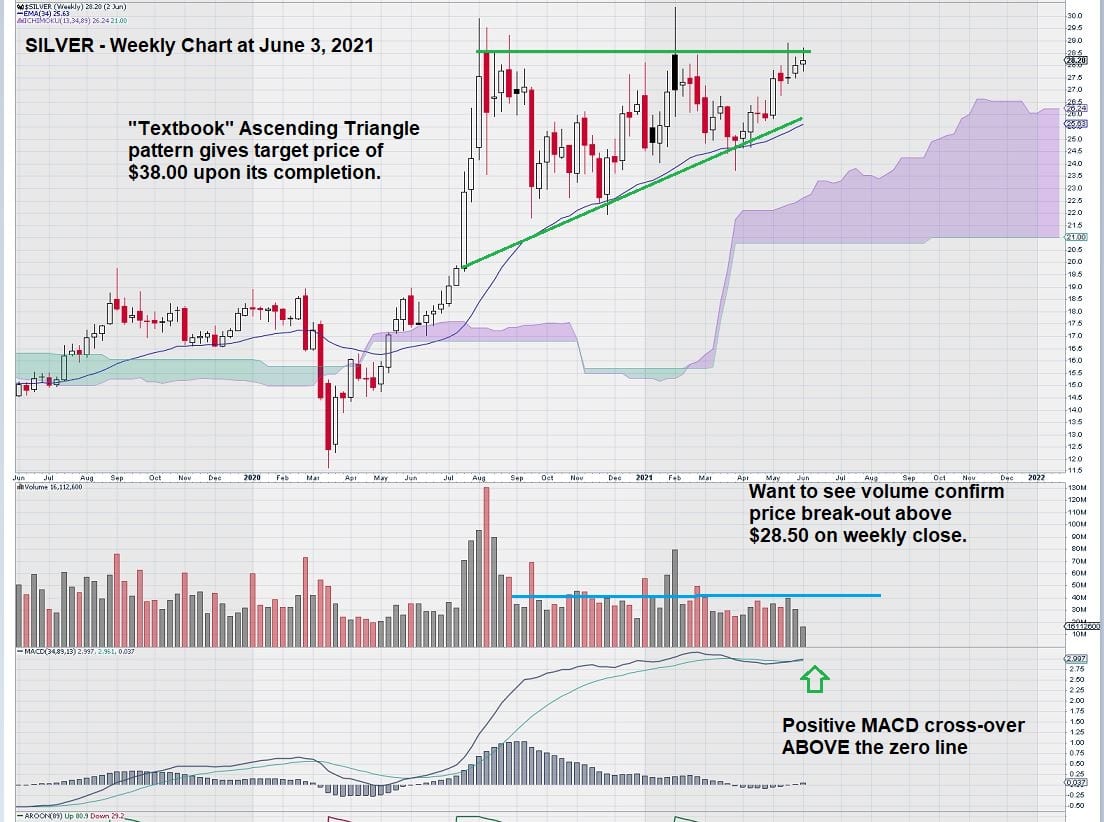
A short time ago, we looked at a weekly chart for silver and noticed that an ascending triangle pattern was almost completed.
Here is the chart that we presented to EQUEDIA readers:
For me, with no apologies for the way my brain seems to operate, I have been “carrying” this chart image in my subconscious. On some level, this chart is being compared to other charts that I may be looking at – without any effort on my part. That is how technical analysts come to be; they look at so many charts over time that they don’t even have to “look” for technical patterns – they just “see” them.
This morning, a daily chart caught my attention.
Why?
You guessed it – another Ascending Triangle Pattern was clearly evident on the chart.
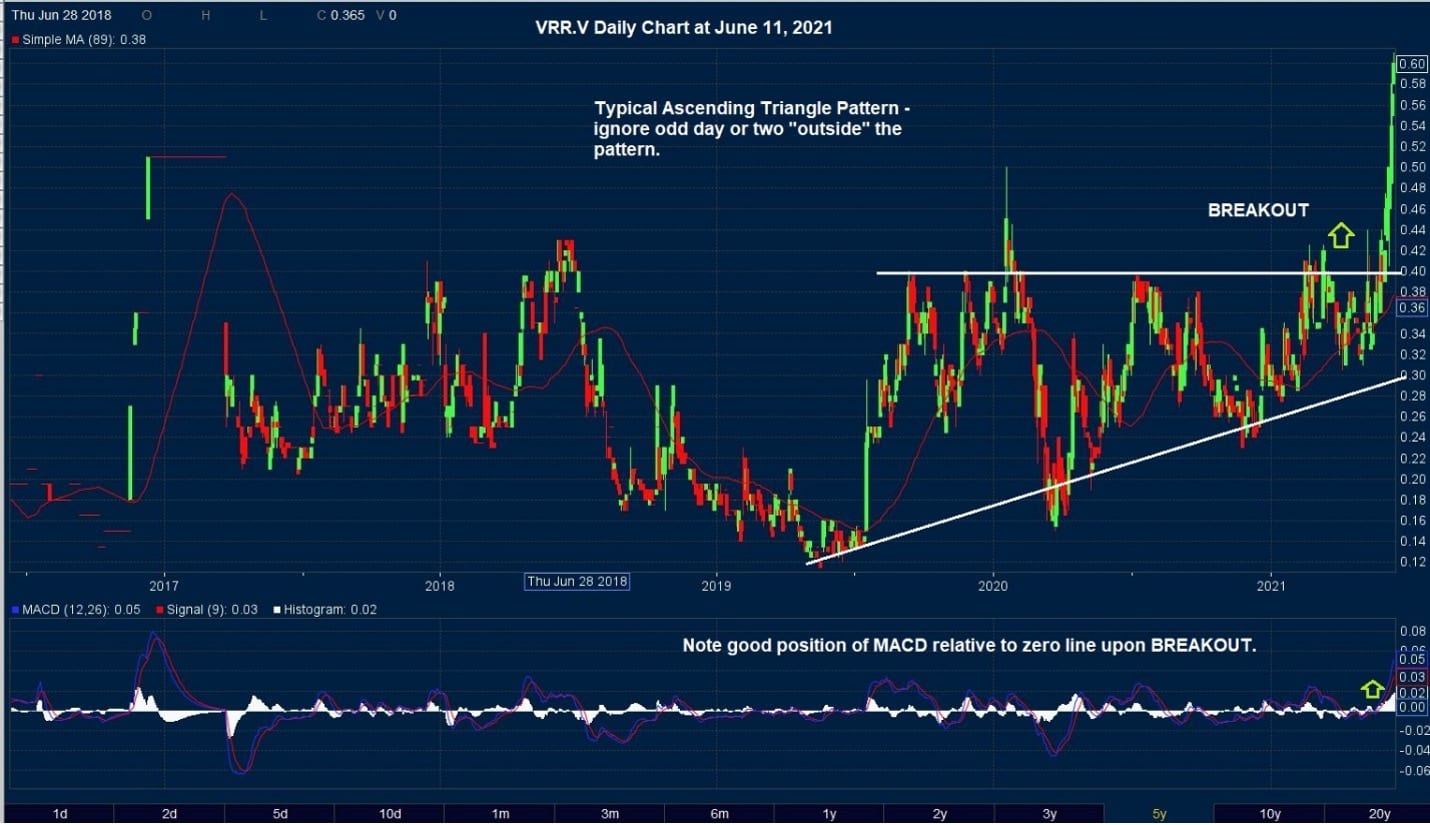
Here is a daily chart for VR Resources Ltd. (TSXV: VRR).
VRR is a junior exploration company that is focused on exploring large copper-gold systems in the western USA and elsewhere.
You may be thinking this thought: “Why are you showing me a chart with a pattern (and accompanying opportunity to trade) when the pattern is in the past, and the minimum price objective has been met?” Good question.
Here is the answer.
In a word (or two) – “reverse engineering.”
This particular chart pattern is telling us to “look back.” What is going on with this company? Why did this pattern form in the first place? What is happening now?
This is the point where I am going to leave that up to you.
Part of the function of the EQUEDIA website is a “teaching” function. You know, the worn-out cliche about giving a man a fish…
Anyways, read up on this company, contact the management, ask a friend – do whatever you need to in order to complete your due diligence, keeping in mind we are using this as a teaching exercise.
It is possible (even likely perhaps) that this interesting chart pattern could be signaling some kind of fundamental change that may re-value the company – even from the current level.
– John Top, the technical trader
PS – In the interest of full disclosure, in the past, I was involved in both West Timmins Mining and Balmoral Resources, two companies managed by the company’s Chairman. However, in writing this article, I have not contacted anyone from VRR and do not own any shares.