Strong Weekly Chart for Alaska Gold Explorer
(Educational Segment 22)
Some charts literally “jump off the page.”
Like the weekly chart for HighGold Mining (TSX-V: HIGH), a gold exploration company with projects in Alaska and Ontario.
Let’s look at the weekly chart for HIGH.V and see why it is of interest to us.
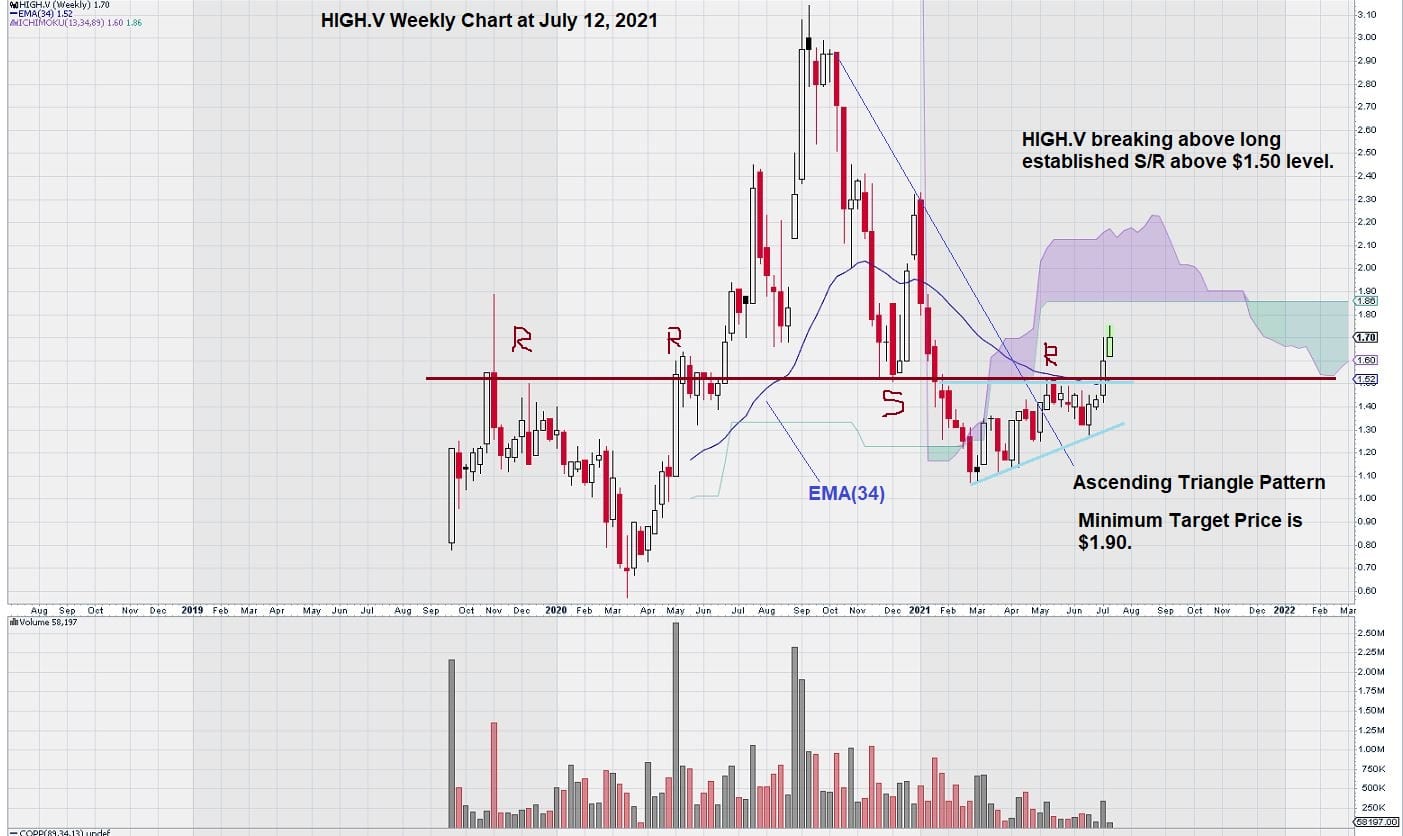
Here we see that there are clear signs that indicate an improving technical picture.
First, we notice that the compact Ascending Triangle Pattern has resulted in consolidation from $1.10 to $1.50. The upper bound of the consolidation is important because it is the key level of Support/Resistance (S/R) that has previously been defined by trading levels in the stock.
Second, the S/R level of $1.50 has been broken to the upside, coincident with a “volume bump.” See the chart. Also, note that before the current break out beyond $1.50, there was a significant volume between $1.10 and $1.30 for three consecutive weeks that helped to put in a “floor price” and commence the process of consolidation within a compact range between $1.10 and $1.50.
Finally, we have yet to see Price rise above the Ichimoku Cloud (red cloud). Remember that the Ichimoku Clouds represent Exponential Moving Averages plotted forward in time. Our Ichimoku Cloud has longer-term trend settings, so we are just now starting to get some “history” from settings that reach back 89 weeks.
Summary and Wrap-Up
HIGH.V has a seasonal exploration program in Alaska that began at the end of May with the commencement of an airborne geophysical survey. Drilling started in June and was highlighted by the announcement of a 25% increase in the size of the drilling program to 20,000 meters.
The company has $17 million in working capital to fund expansion drilling of several very high-grade gold intercepts identified in the previous 2020 exploration season.
We will continue to track HIGH through 2021 and keep our readers updated on any significant exploration developments that may lead to a re-rating of the share price.
Disclosure: I own shares.
–John Top.