


This is the second installment of RIP 60/40, which dives into the investment implications of the sweeping economic and political changes discussed over the past months…
… a paradigm shift that hints at the first innings of the Great Reset Ivan predicted years ago.
(If you missed the first letter, I recommend reading it first.)
I planned to fit it all into two letters. But after the first issue, it became clear that it would barely scratch the surface. So, we’ll extend the series into a final third installment next week.
Here’s a brief recap from last week:
- the monetary rock bottom and how it imbalanced the global economy
- why the Fed’s rates are the economy’s most important figure and how it unleashed a speculation frenzy across asset classes
- the domino effect of economic complications the Covid stimulus set off and how it’s feeding the biggest inflation since the ’70s outbreak
- why monetary tools to bring the economy back into equilibrium can’t be effectively deployed
- why the 60/40 portfolio won’t work the same way it worked during the last four decades.
Today we’ll look at the changing role of stocks and bonds in today’s portfolio, and how we can fix the 60/40 allocation to diversify and maximize returns in the new regime.
As you’ll see, things aren’t as black and white as the media portrays.
Let’s dive in.
Tailwinds of the 60/40 Sails
As discussed last week, the 60/40 strategy has been the bread and butter of portfolio allocation since the 1980s – a bullet-proof strategy that generated reliable returns in the low double digits for decades.
From Part I:
“For the past 40 years, the 60/40 portfolio has been riding on two macro tailwinds:
-
- Falling rates
- Low inflation
This setup created a perfect environment for bonds and stocks.
You see, stocks thrive on lower rates because cheap money brings down their cost of capital (WACC). Then the lower WACC shrinks the discount rate on future earnings, which, in turn, props up stock valuations. (And vice versa, of course. This is why you see so much volatility in the stock market ahead of the Fed’s hikes.)
Meanwhile, at higher rates, bonds yield more. And when inflation is in check, the safest Treasuries can beat CPI and earn a little on top. That’s a far cry from today when even speculative junk bonds earn a negative real yield.
More importantly, bond portfolios typically rise in value when rates fall. That’s because the lower yield on newly-issued bonds makes your higher-yielding bonds more valuable in the market. So, in a period of higher rates that are falling, not only do bonds yield more, their market value grows, too.”
The 60/40 portfolio won’t cut it anymore because both 60/40 tailwinds are gone.
After a 40-year downtrend, interest rates have bottomed. And with exploding asset prices, they aren’t going any lower.
Meanwhile, inflation blew past figures we haven’t seen since the ’70s inflation breakout.
Central banks have little choice but to raise rates, which technically doesn’t bode well for stocks and bonds.
Take the beginning of 2022, for example.
In the first two months, the average bond allocation lost 4.5%.
Meanwhile, U.S. stocks shed 9.5% of their value. And the Fed has yet to lift a finger.
So, the question is: should you shy away from stocks and bonds altogether?
Well, not quite…
Why Stocks Will Still Play a Leading Role When Rates Rise
In isolation, higher rates are bad for stocks.
They raise WACC—which means investors have to discount future earnings at a higher rate. In turn, the stock’s theoretical value plummets, and so does its appeal against other asset classes, such as bonds.
But the thing is, things don’t happen in isolation – especially in a complex and intertwined economy.
For example, rising rates often coincide with a booming economy, as is the case today. And when the economy booms, earnings grow like weeds, which often outweighs the negative effect of rising rates.
In fact, a recent Blackrock study showed that since 1995, stocks have more often than not grown in value when rates were rising from low levels (emphasis, again, on low levels).
Via Blackrock:
“Since 1995, in months when the U.S. 10-year treasury yield rose by more than 50 basis points (bps), over the following three months the S&P 500 posted a price gain of 3.2%, roughly 100 bps higher than a typical month.
The case for stocks and rates moving together is even stronger when comparing valuations to real interest rates, i.e., rates minus inflation expectations.
Looking at data since the inception of the Treasury Inflation-Protected Security (TIPS) market, real rates and equity multiples typically have a strong positive relationship.
In other words, higher real rates have been associated with higher multiples. Based on this relationship, you would expect a 50 bps rise in real rates to be associated with equity multiples moving up by one point.
While real-life is unlikely to conform exactly to the model, the relationship illustrates that real rates and multiples generally move together.”
Now, the question is how far the Fed is willing to go to clamp down on inflation and speculations.
If we saw anything even remotely close to the 1980-81 hikes, the economy (and stocks) for sure wouldn’t hold out. But with so much debt, such tightening is unlikely. Even then, stocks will, at the very least, breakeven on inflation in the longer term.
A recent Goldman Sachs analysis showed that stocks beat inflation 100% of the time in any 15-year period. That includes the devastating period betwen 1970-1985 when interest rates peaked at 19.1%!
Take a look at this chart:
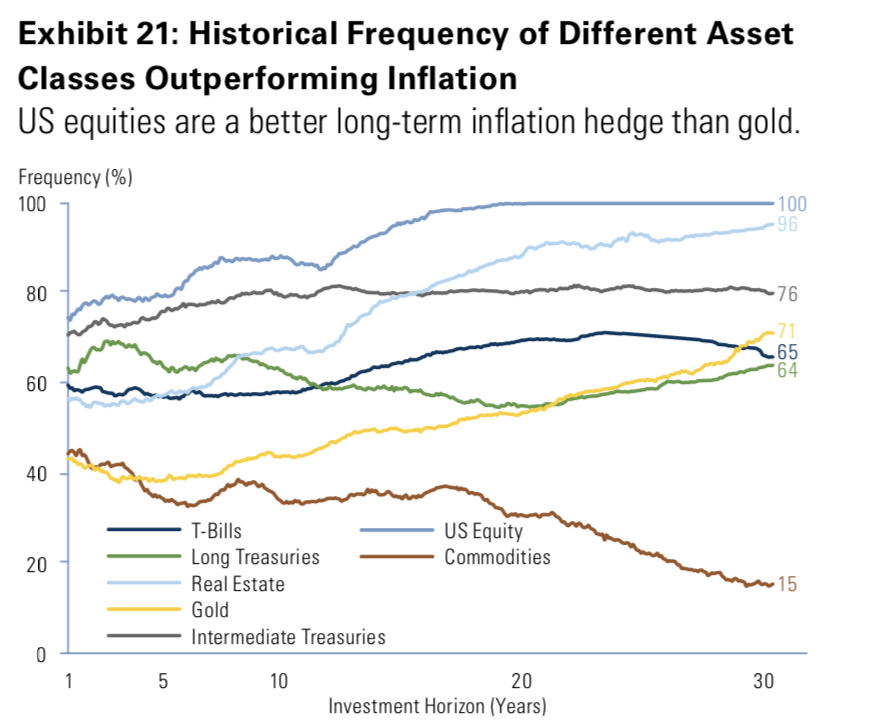
So while rising rates may be a technical headwind—and today’s lofty equity valuations cap their upside—history shows stocks still play a leading role in the portfolio. Even if just for preserving your wealth.
Of course, the flip side to this is what Ivan so often tells us: the Fed is in control. What do I mean? If it was the Fed’s goal to reset the entire system, it could easily do that by forcing interest rates to levels not seen since the late 70’s and 80’s. The Fed could blame runaway inflation, but if rates hit those levels today, the entire financial system would collapse overnight. Asset prices would crash. Real estate would fall. And millions, including governments, would go bankrupt.
That would be the ultimate Great Reset.
But that’s a whole other topic for another time.
For now, let’s get back to the other financial asset class: bonds.
What About Bonds?
Unlike stocks, bonds will bleed as long as interest rates go up.
In fact, they already are.
For example, longer-term Treasury bonds have lost nearly 20% of their value since mid-2020, as you can see here:
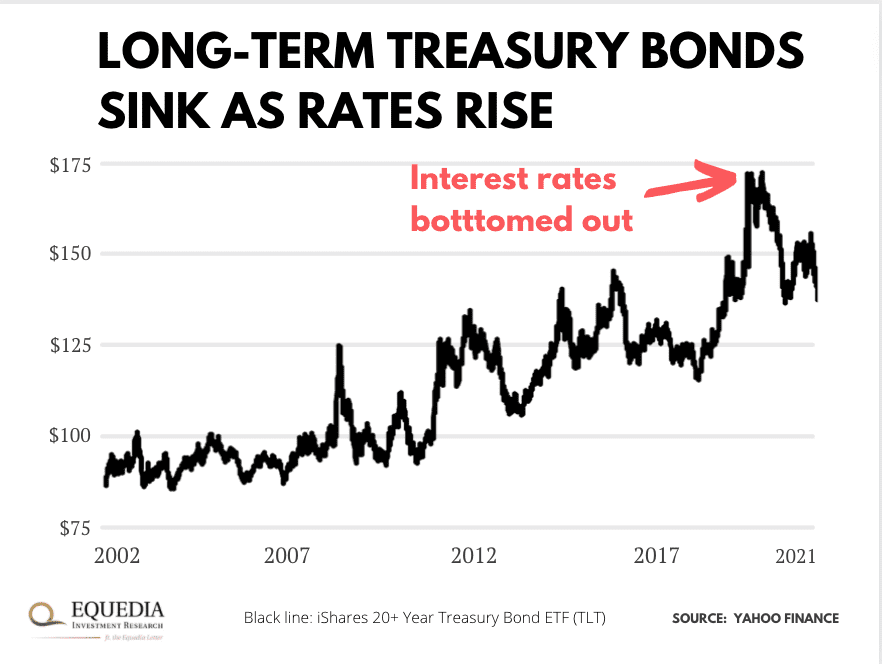
That’s because bond yields are fixed, and their sensitivity to rates comes down to a simple yet lesser-known metric called duration. (Don’t confuse it with time to maturity, which is a different metric.)
The bond’s duration reveals some important things about the bond.
First, it shows how many years of coupon payments it will take for you to recoup the principal. Second, and more importantly, it estimates the probable change in the bond prices on a 1% change in interest rates.
So, if a bond or bond fund has a duration of 5, its price will theoretically decline by 5% if interest rates jump 1%. And vice versa. If rates go down by 1%, the bond’s price will rise 5%.
You can find this metric in the technical specs of any fund:
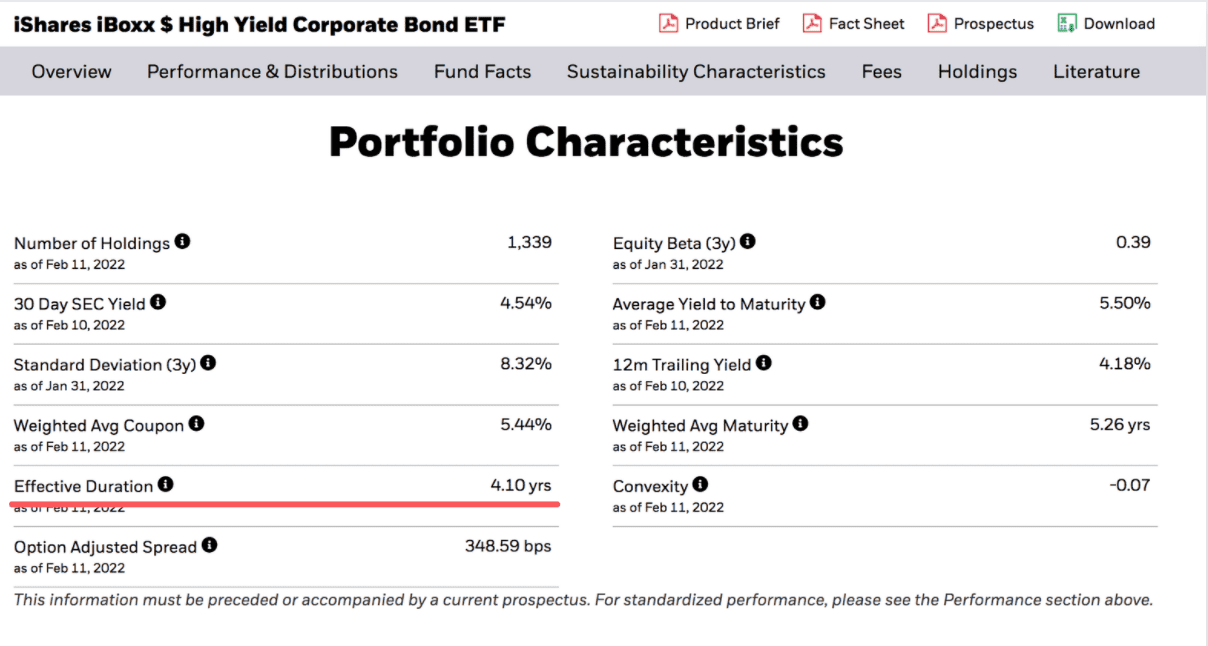
In other words, duration is an interest rate leverage in bonds.
Here’s a simplified scenario to illustrate why bonds work that way.
Say you’ve bought a 10-year Treasury that entitles you to 0.5% interest payments for the next ten years. Then the U.S. Treasury auctions off the same 10-year bond, but with a 1.5% interest rate.
Now you want to sell, but why would investors buy your bond earning 0.5%, when they can buy the newly issued bond that pays 1.5%?
And just like that, the market value of your bond plummets.
So, if you wanted to sell the bond, you’d have to sell it for a discount to match the newly issued bond’s earnings over its lifetime. Otherwise, no investor in their right mind would buy it.
How do you determine the discount rate?
It depends on the bond’s time to maturity and its yield—the two things that duration factors in. The lower the yield and the longer maturity, the bigger total income difference between your bond vs. the higher-yield new bond.
Still, that doesn’t mean you should shy away from bonds altogether.
Bonds play an important role in counterbalancing stocks in the portfolio. And you can easily minimize losses from higher interest rates by picking bonds that are less sensitive to them.
For example, you could diversify into shorter-duration bonds. Or, as counterintuitive as it sounds, you could swap out risk-free Treasuries for risker junk bonds. They have a lower duration and are typically safer in a rising interest environment.
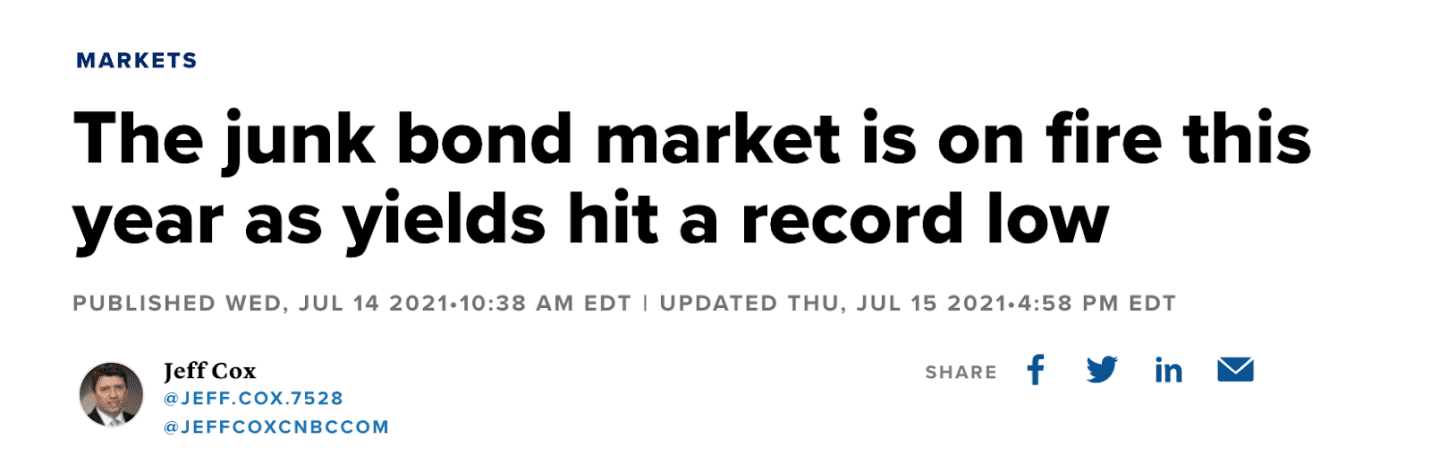
In fact, when rates rise, high-yield bonds almost always outperform any other fixed-income investment.
This explains why funds piled into junk bonds during Covid when the economy was teetering on the edge, and junk yields hit a record low that didn’t even break even on inflation:
If you invest in diversified bond funds, interest rates are also less of a worry—especially if you hold these funds long enough.
See, as rates rise, bond funds will add new, high-yielding bonds to the fund. And in the longer term, higher yield in the portfolio will dilute losses from lower-yielding bonds.
There’s even a formula for that.
Marketwatch columnists Mark Hiulbert sums it up here:
“To maintain their average duration, bond funds employ what’s known as a bond ladder. With a ladder, the proceeds of any bond that matures are reinvested in another bond with a sufficiently long maturity and duration so that the ladder’s average remains more or less unchanged.
Notice what this means for how a bond ladder responds when interest rates rise. Though the prices of previously-held bonds will decline, new bonds will constantly be added to the portfolio with higher yields. It turns out that over time, those higher yields make up for those price declines.
How long must you hold for this happy result to occur? One year less than twice the bond ladder’s average duration. That’s according to a formula derived by Martin Leibowitz and Anthony Bova, managing director and executive director at Morgan Stanley, respectively, and Stanley Kogelman, a principal at New York-based investment-advisory firm Advanced Portfolio Management.”
That said, with an expected three to four hikes this year alone, you shouldn’t expect much from bonds in terms of return. And that’s fine if you use this asset class for what it truly is: insurance against risk assets.
Just like with homeowner insurance, you incur a little cost to shield your asset from a massive loss in case of a disaster. Only today, that cost is a bit higher than it was during the last four decades.
But what about making money, not just preserving it?
The Great Rebalancing
If bonds bleed and pricey stocks can hardly pick up the slack, how are you supposed to earn a decent return? (After all, many retirement plans are banking on 6-7% annualized return to hit their goals.)
The short answer: rebalance.
For example, some portfolio managers are switching to an 80/20 allocation. They cut the bond allocation in half and replace it with stocks hedged with derivatives, such as options.
In theory, this strategy can minimize bond losses and capture more equity upside with a similar risk profile.
(Note that our discussion barely scratches the surface of portfolio construction. Each allocation has complex nuances that may or may not work for you. So, consult with your financial advisor as to what best fits your risk profile and investment goals.)
Investors are also moving to alternatives.
Take a look at how institutional investors are shying away from bonds and plowing their money into alternative assets:
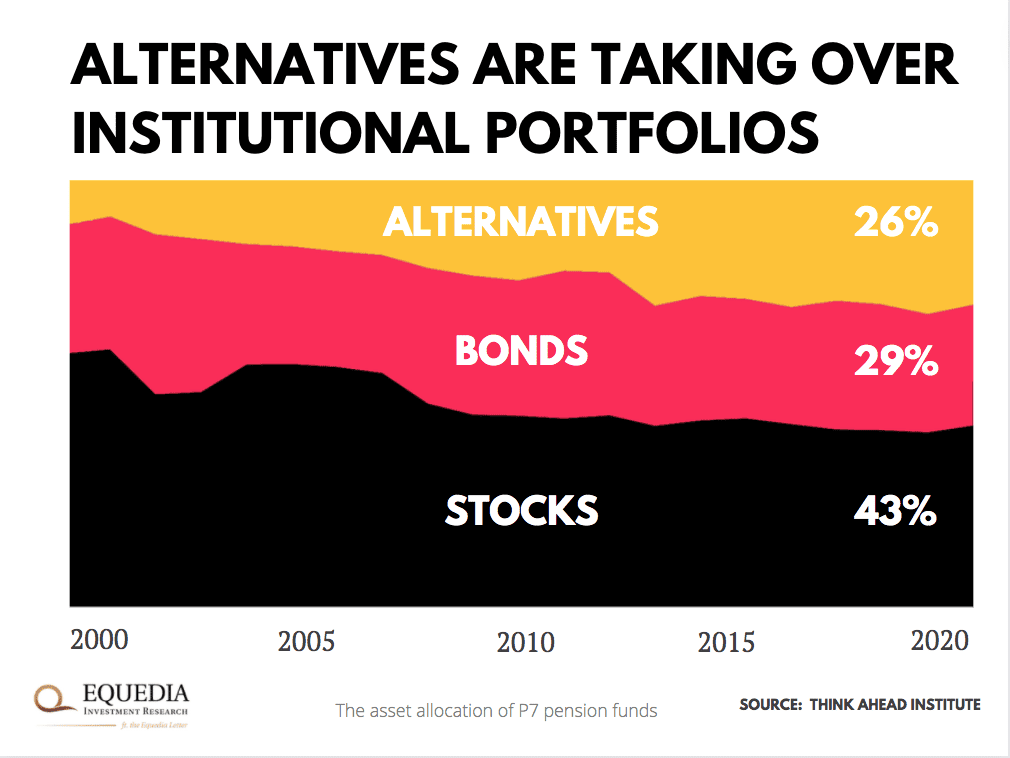
In fact, half the money that historically went into bonds is now piling into alternative investments.
But what are those?
We’ll talk about that next week. Stay tuned…
Seek the truth,
Carlise Kane


For the most part I have no idea what you said in this article.
Sorry but I’ll bet 90% of your readers were also confused.
It would be more interesting if you would have written about how Nancy Pelosi and her
Communist Democrats passed legislative laws, during the Odumbo Administration,
that allowed them to do INSIDER TRADING. Which is ILLEGAL for everyone else.
And top it off with the approx. 45 million $$ Nancy & husband made with this secret law.
And buying off the Communist MEDIA to stay quiet about this.
Very good letter. You are SPOT on.