The widely followed S & P TSX Global Gold Index continues to lag the recent strong and bumpy performance of gold.
Regular readers will already know that my single-minded focus has been on “THIS” key level ever since it broke down early in 2013. Why was “THIS” level so important before, and why is it even more important now?
Let’s take a closer look.
The Golden Re-Set: 2008 – 2013
History reminds us that 2008 was a time when market confidence was truly shaken to its core. Inter-bank credit “froze” and large price dislocations were seen across many types of markets, including gold equities. Near the end of 2008, gold equities found support, and a very strong rally ensued from around 180 to 440, as measured by the TSX Gold Index.
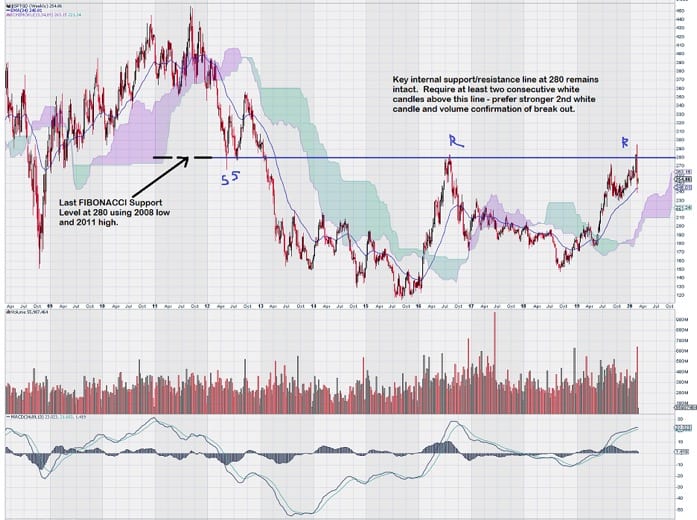
Next, a fairly typical retracement occurred that “obeyed” Fibonacci levels that could be derived from the low and high levels reached. In particular, the last Fibonacci retracement level at 61.8% coincided with the 280-level, as shown on the price chart. The 280-level held twice, but once tested a third time, it broke down.
A few months later, in April 2013, gold suffered a large defeat at what many believed was selling designed to deliberately “hurt” the price. It worked, and gold seemed like it was “pressured lower” for the next three years. See the link below for a good re-cap of events.
So what happened to gold stocks?
They fell lower and stayed low until 2016, when they traded upwards, back to the key overhead resistance level of…you guessed it…280.
Gold stocks could climb no higher and were immediately rebuffed. They quickly gave back more than 50% of their gains.
 Now we come to today.
As can be seen on the weekly chart for the TSX Gold Index, the 280-level was once again reached and briefly penetrated to the upside. But, on cue, it did not hold.
So what happens next?
Both MACD and Trend Momentum are currently positive. This is a good sign. Despite the volatility we have seen over the past 12 -15 trading days, the weekly chart remains in good shape.
The More Things Change – The More They Remain The Same
Has anything really changed the way we view gold stocks? The quick answer is no.
Our longtime target and expectation is cast in stone. We need to see at least two consecutive weekly closes above the 280-level for the S & P TSX Global Gold Index. This line of reasoning, which is based on longterm observations of how Fibonacci retracement levels seem to have a way of defining absolute levels (pivot points) on which sentiment turns.
Chart followers must see encouragement that the recent market dislocations did not come anywhere close to having the TSX Gold Index close below its EMA (34), which is just over $1500.
It is a good time to start refining a list of “picks” in the gold sector. Each investor, by way of their personal risk profiles, will have a different idea of how to invest in the gold sector. There are lots of ways to get the appropriate level of exposure for anyone who wants it.
Obviously, one of these companies we feel fits our model can be found here: CLICK HERE
A Future Caveat: There Is Nothing Wrong with A Re-Test From Above
Let’s say the TSX Gold Index makes an impressive break-out through the 280-level to somewhere well above 300. Then, it starts to weaken, coming all the way back down to around the 280-level. This future trading action may not occur, but if it does, then there is no need to abandon gold stocks.
Seasoned chart followers will recognize this trading pattern as a simple “Re-Test From Above.” The multi-year strength of the resistance at 280 now becomes support when tested from above.
Summary: Wait, Watch, React
In 2020, gold (Continuous Contract EOD) had its highest-ever trading volumes – both up and down volume for a single week reached new highs.
Gold stocks that make up the TSX Gold Index, in aggregate, had neither new highs in volume for both up and down volumes in 2020. This tells us that gold stocks remain in strong hands and that there is a future gold price that will act as its own “pivot point” to bring enough trading interest to gold stocks to take out the overhead resistance level of 280.
Each time the 280-level is tested, and it holds as resistance, it becomes weaker.
The next and successive tests require less “trading energy” to push through. So far, we have seen two good tests of the 280-level; one in 2016 and the other just last week.
We look for signs of increased trading interest by way of increasing volume.
Gold stocks continue to lag gold, and this creates trading opportunities.
Unlike many other investors, we have been closely following the TSX Gold Index since its inception in late 2000. Two decades later, it has shown us that the Fibonacci Retracement Level of 280 is the key pivot point – let’s not lose sight of it now!
-John Top
************************************************************
Note: At the time of writing, the S & P TSX Global Gold Index closed at 256.