Charting BITCOIN – Volume Sheds Light on Future Price Action
This morning the various volume spikes for BITCOIN caught my eye.
In particular, what became obvious was that volume, when properly interpreted, gave some important clues about future price action.
For BITCOIN, volume takes on three distinct interpretations, depending on where that volume occurs on the price chart.
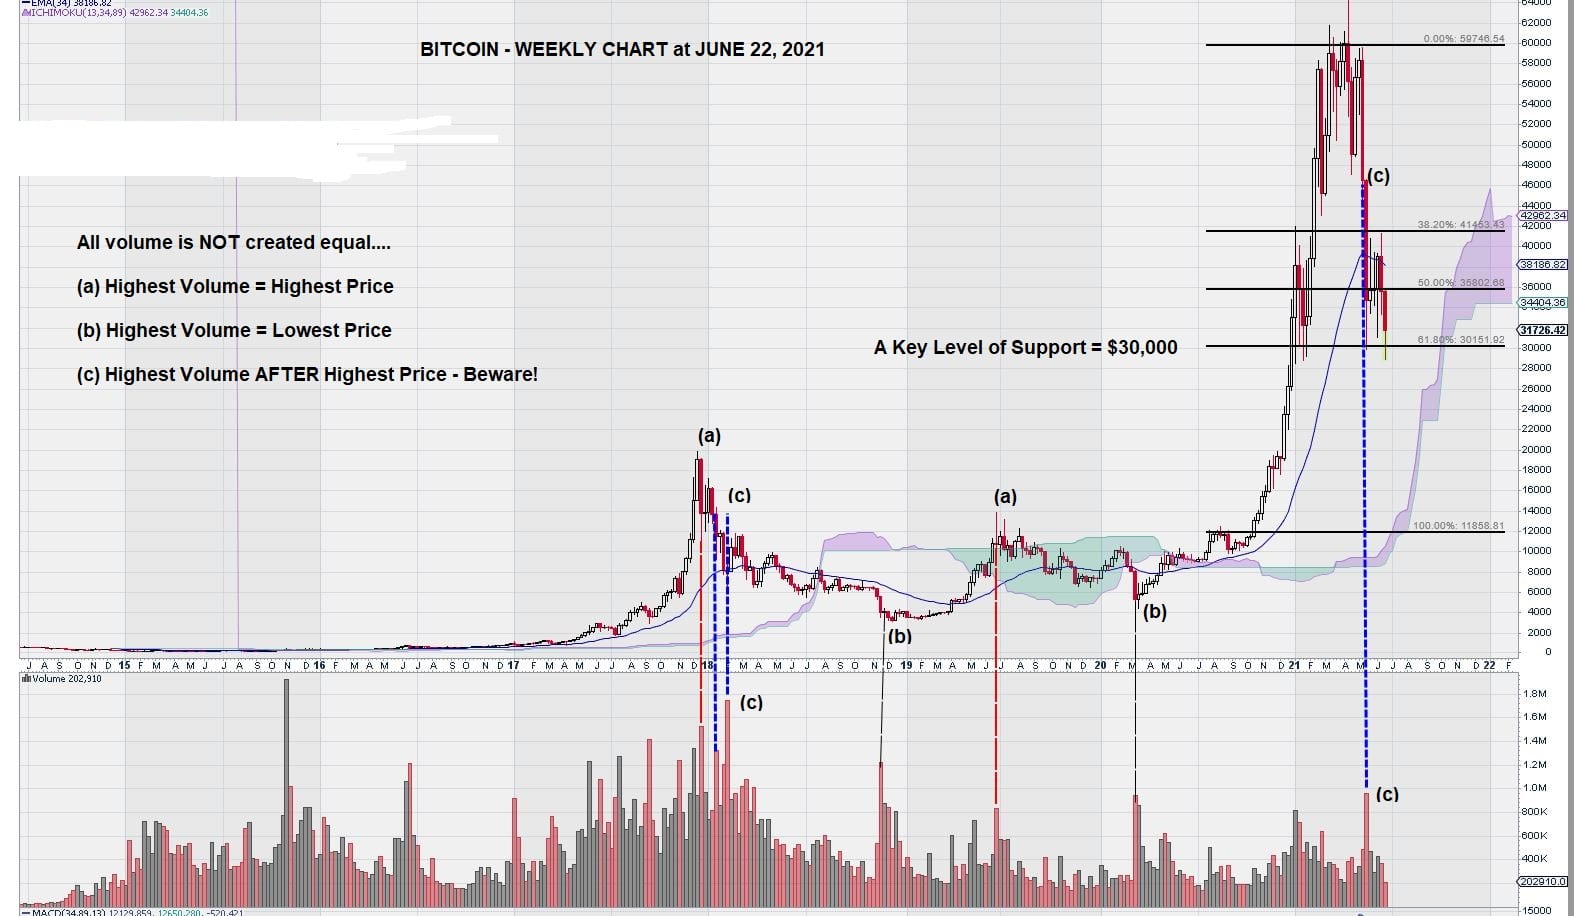
First, we notice that the old trader’s adage of “Highest Volume = Highest Price” is shown to be true on the chart denoted by “(a).”
This is what one would normally expect – that is to say, Price reaches a level that induces a strong contingent of holders to sell. This creates a volume spike that ends the price rally before consolidation or collapse sets in.
Second, it is equally apparent that a volume spike can define a bottom. Again, this is what one would expect to happen for the opposite reason; Price reaches a low enough level that bulls overwhelm the bears, and the selling pressure is relieved. Price recovery soon follows. See the chart notations “(b).”
Third, we can see what happens when volume occurs in the “wrong place” – the “bad place” – the place where traders and investors have to become extremely cautious.
In the past, we may have mentioned it, but this time we highlight it for the benefit of our readership. A volume spike on the backside of a new Price high can spell trouble for the Price.
See the chart and note where “(c)” occurs. These volume spikes are a bit more ominous. They represent something different on the chart.
What this type of volume shows and includes are holders who have become sellers who might otherwise remain holders. Perhaps the nagging questions of “buy/sell/hold” as Price starts to decline are “answered” in the form of the sustained selling pressure that creates the volume spike. In any case, they lose their will to remain holders and become sellers.
These volume spikes on the backside of new Price highs damage a chart in another way.
On the BITCOIN weekly chart, we can see that once the volume spike occurred in early 2018, only time was able to heal the chart damage. It took another 2 ½ years before BITCOIN recovered to a price level beyond the level of the volume spike.
Holders of BITCOIN must now ask themselves the same question: are they prepared to hold BITCOIN for what could be years before it recovers to the level of the current volume spike?
Another strong consideration for holders of BITCOIN is the key level of $30,000. This level coincides with an intermediate Fibonacci Retracement level using a low of $12,000 and a high of $60,000.
It will be interesting to see if BITCOIN will obey the “laws of charting.”
John Top.