This morning, while out for a “mostly mask-less walk,” avoiding my fellow man like they were lepers, my phone rang. It was a CEO of a small gold exploration company with an unusual hobby – an obsession with the US Federal Reserve’s various moves. He had a simple question: “What does the weekly chart for the 10 Year US Treasuries look like – how is it in relation to the Ichimoku Clouds?”
Here is the chart that I sent him:
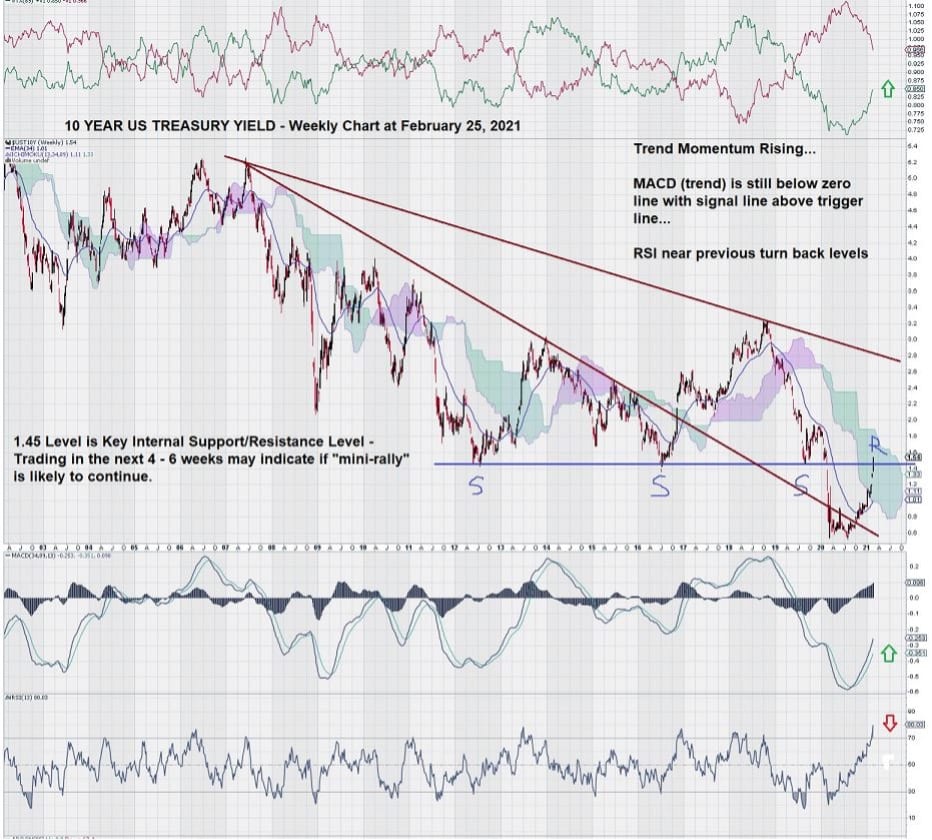
The current level of the $USD 10 Year Treasury Yield is slightly below 1.50%. As you can easily see by the weekly chart, this level was support in the past, and now it is resistance. But how much resistance?
We will continue to monitor this chart in the weeks ahead with a view of seeing if the yields continue to rise or are ready to turn lower.
The high level of RSI above 70 is more suggestive of a future decline than an advance. But as we all have seen many times before, some indicators, RSI among them, can remain at overbought levels for extended periods of time.
Trend MACD is still well below the zero-line, but both the trigger line and the signal line are in the correct position for positive advance.
Ichimoku Clouds offer few clues as to future trade direction.
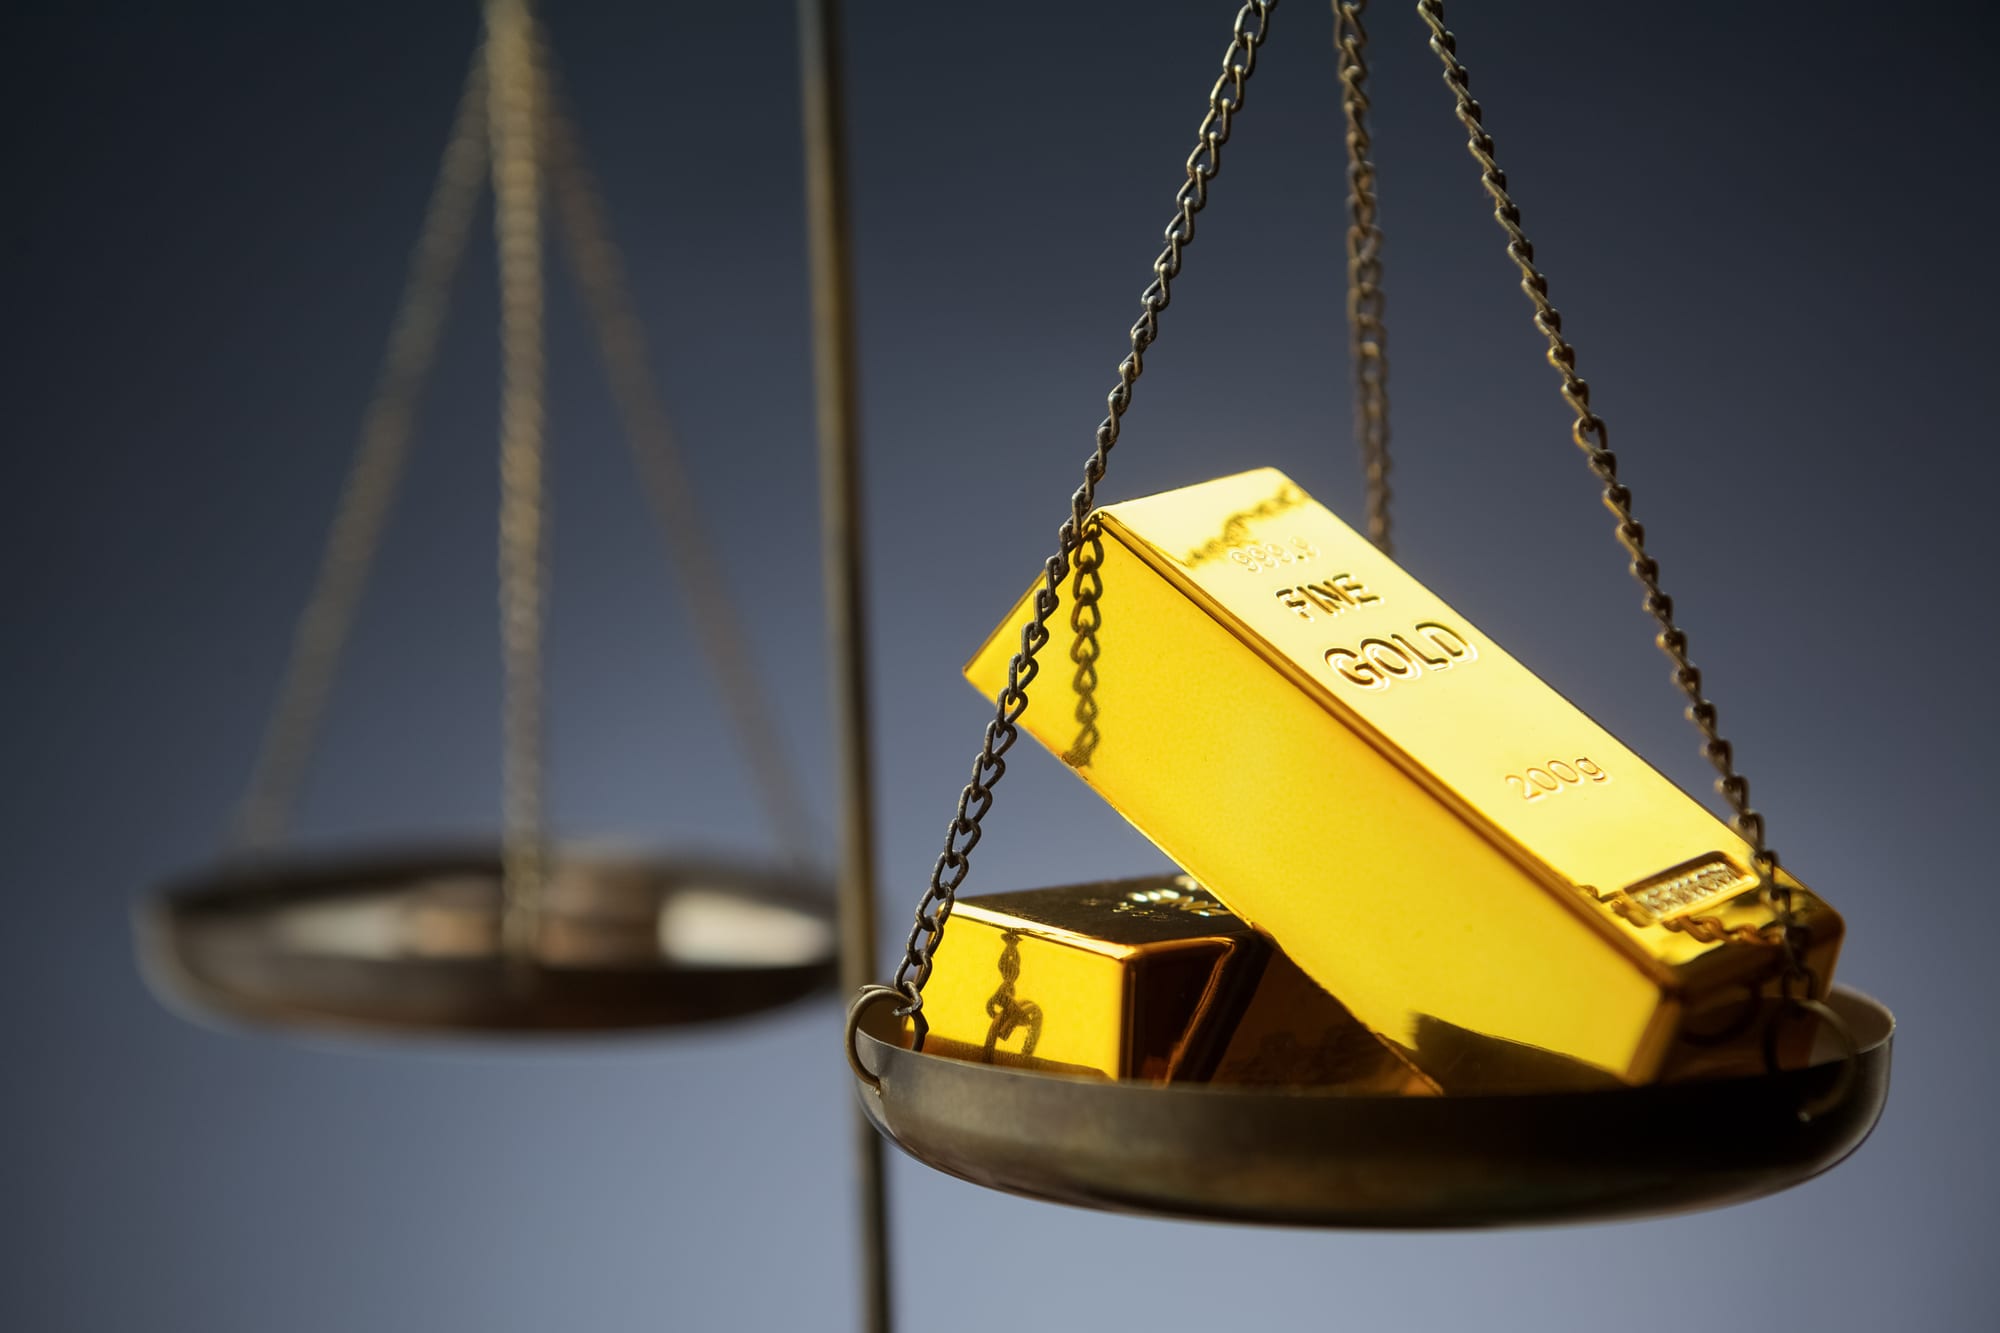
This chart has become the focus of the gold industry.
Many podcasts, interviews, and reports share a common theme to explain the recent decline in the gold price. The shared premise is that rising yields are putting downward pressure on the gold price.
Gold is favored by investors during times when there are negative real interest rates. A negative real interest rate results when the inflation rate is higher than the nominal interest rate (taken by most economists to be the US 10 Year Treasury Bond Yield). So far, the vast amount of stimulus (money printing) has not worked its way through the economic system to impact the inflation rate – but it is generally agreed that it’s not a question of “if” but rather a question of “when.”
Thus, in the intervening period, the one we are in now, any rise in the 10 Year T-Bill Yield is considered negative for gold because rates are seen to be rising faster than inflation.
The negative real interest rate is becoming more positive; this is seen as negative for gold. Gold investors are closely watching the 10 Year T-Bill Yield and have become sellers lately.
In the weeks ahead, we will continue to keep a close eye on the weekly chart highlighted above.
As noted on our latest weekly chart for gold, we see that from the multi-year break-out level of around $1350/$1375 to a high weekly close of $1940, the approximate 50% Fibonacci Retracement is around the $1700 level. This will be a short-term test for the gold price.
The last remaining Fibonacci support level is just over $1600. It is important to bear in mind that these levels are “interim levels” because we are not using the recent low level of $1050 but have chosen the higher level of $1350 for our “low” because it was such strong resistance over a six-year period.
Returning to a final comment for the US 10 Year T-Bill Yield, it was noted that there is a “hard upside” to rates in the mid-single digits. Why is this so?
The level of US Federal Debt outstanding is at a level where it is estimated that a rise in interest rates to around 5% would mean that about ½ of all taxes collected would be required to service the interest obligations on the debt.
This is why there is a prevailing school of thought that the only viable way out of this “debt spiral” is to simply inflate your way out of it. See our latest brief note entitled “Do Zeros Matter?” If so, then gold investors have to be patient and simply let inflation start to dictate terms to the negative real interest rate.
One of the world’s greatest speculators, Jesse Livermore, emphasized many times that his greatest gains came from “waiting.” A golden lesson worth noting.
-John Top, the technical trader